Figure 1.
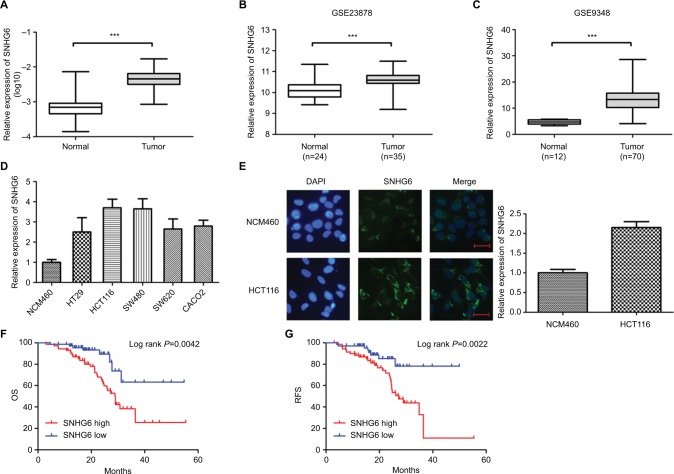
SNHG6 is overexpressed in CRC tissues and cell lines and associated with poor prognosis.
Notes: (A) The relative expression levels of SNHG6 to GADPH as determined by qRT-PCR in 141 paired clinical CRC and normal tissues. CT values for GAPDH in normal tissues and tumor tissues were 21.3±2.72 and 20.8±3.14, respectively. CT values are presented as mean ± SD. (B and C) Expression levels of SNHG6 in CRC and normal tissues from GEO microarray datasets. (D) Expression levels of SNHG6 in a normal colorectal epithelial cell line (NCM460) and CRC cell lines (HT-29, HCT116, SW480, SW620, and CACO2). (E) Representative FISH images showing SNHG6 expression in NCM460 and HCT116 cells. Scale bars =50 µm. The relative expression of SNHG6 (fluorescent intensity and area) was determined using ImageJ software. Kaplan–Meier analysis and log-rank test were used to analyze the association between SNHG6 expression and (F) OS and (G) RFS in 141 CRC patients. Patients were divided into SNHG6 high and SNHG6 low groups by median value of SNHG6 expression. ***P<0.001.
Abbreviations: CRC, colorectal cancer; CT, cycle threshold; FISH, fluorescence in situ hybridization; GEO, Gene Expression Omnibus; OS, overall survival; qRT-PCR, quantitative real-time PCR; RFS, relapse-free survival.

