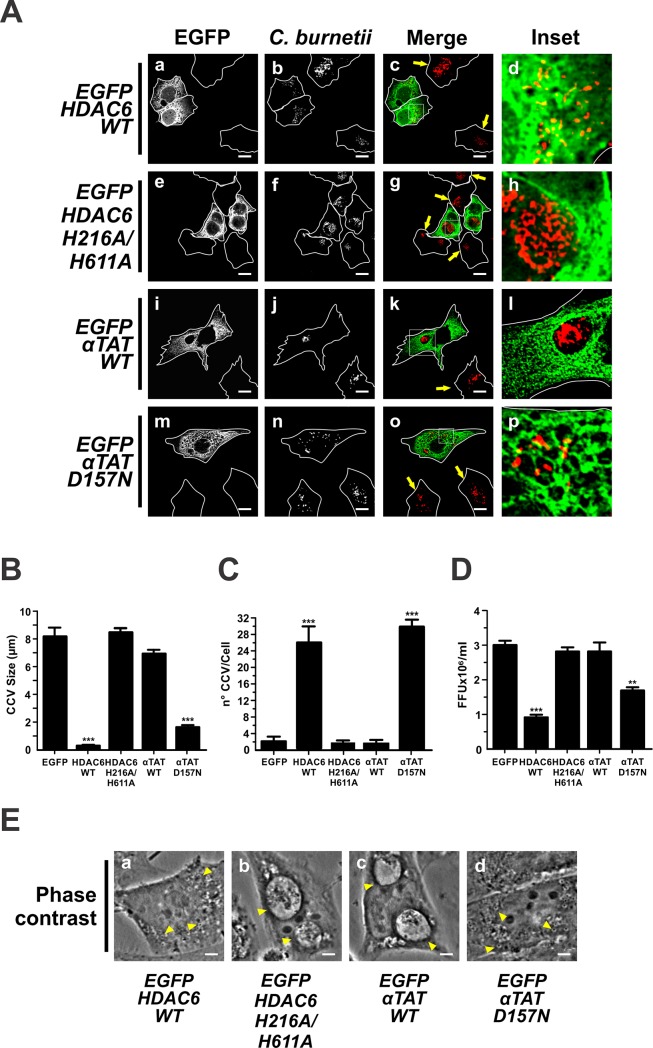
Fig 2. Overexpression of HDAC6 and αTAT regulate the formation of CCV.
(A) Infected HeLa cells were transfected with pEGFP-HDAC6WT (panels a-d), -HDAC6 H216A/H611A (panels e-h), -αTAT WT (panels i-l) or -αTAT D157N (panels m-p). Cells were fixed and processed for IIF. An anti-C. burnetii (red pseudo-colour) antiserum was used for detecting bacteria. Arrows indicate untransfected cells containing CCVs. Scale bar: 10 μm. Quantitative analysis of CCV size (B), number (C), and bacterial multiplication (D). Forty to sixty cells were analysed in each experiment. Results are expressed as means ± SE of three independent experiments. **p<0.01, ***p<0.001. (E) Phase contrast microscopy of infected and transfected HeLa cells. Arrowheads indicate a nrCCV (panel a and d), and a CCV (panel b and c). Scale bar: 2 μm.

