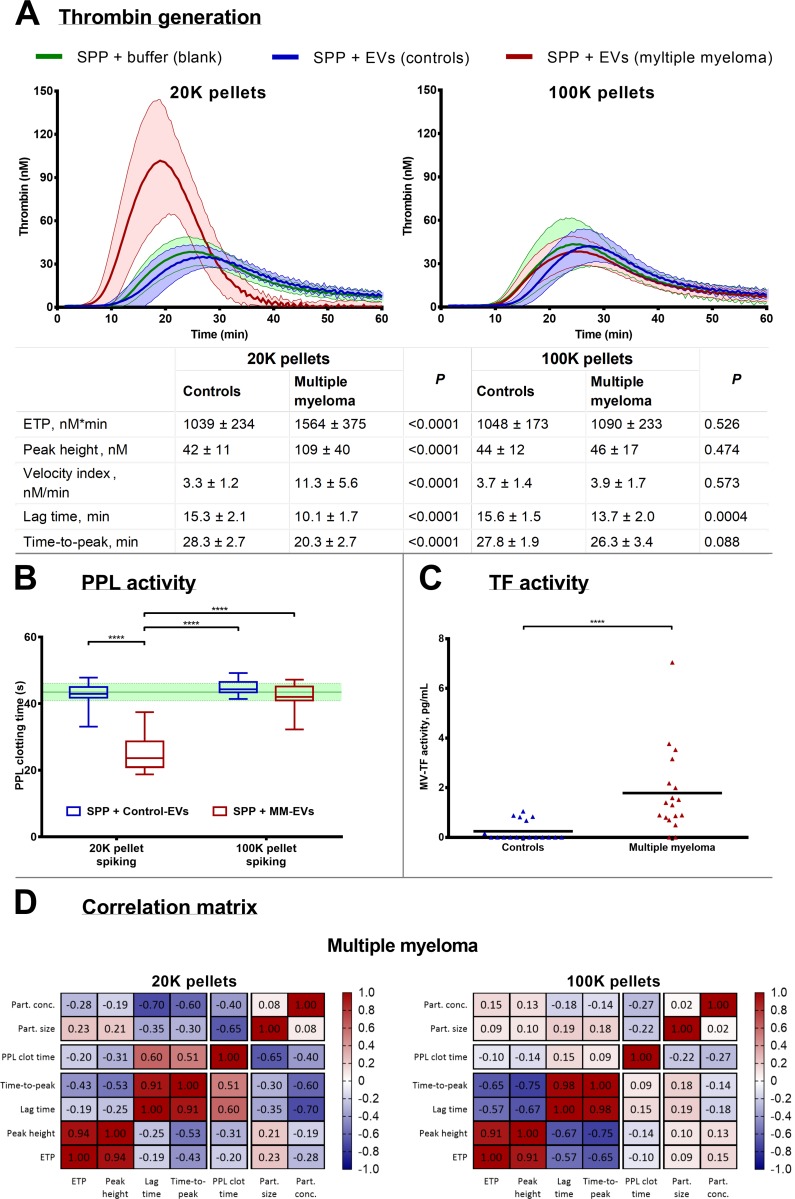
Fig 2. Analysis of procoagulant activity of EVs in SPP.
A) Thrombograms (mean ± standard deviation) depicting thrombin generation when SPP is ‘spiked’ with isolated EVs from controls and MM patients. The results on individual thrombin generation parameters (ETP, peak height, velocity index, lag time, and time-to-peak) are listed in the table as the means ± standard deviation including P. B) PPL activity measured in clotting time differences in SPP ‘spiked’ with isolated EVs. The boxplots depict the median, the 25 and 75 percentiles and the whiskers min to max and the green line and area represent the reference range (mean ± standard deviation) of the SPP. C) Analysis of MV-associated TF was performed on MV suspensions, and MM patients contained overall more TF than controls. D) Correlation matrix depicting the Pearson’s r for correlations between coagulation and particle analyses for the MM pellets. ****P<0.0001.

