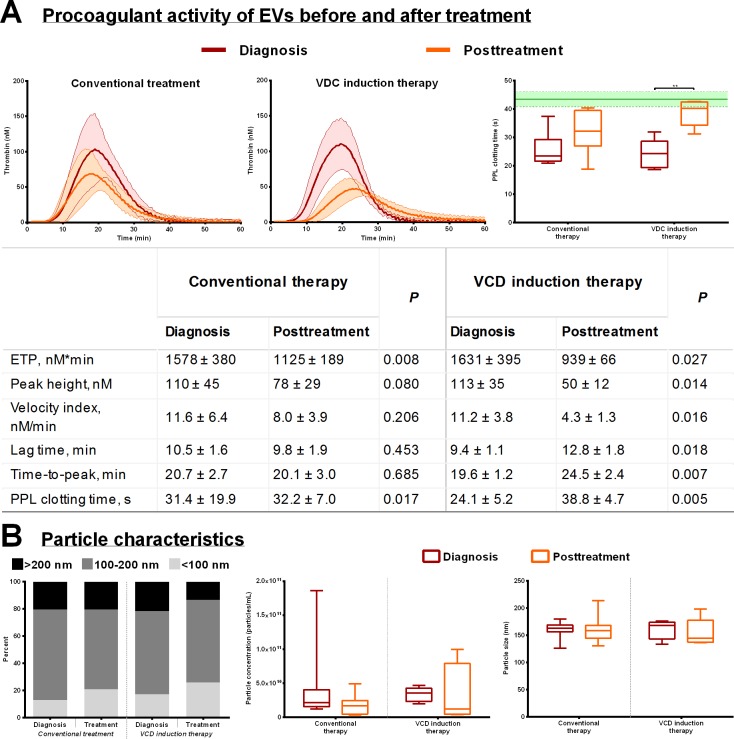
Fig 3. The procoagulant activity of EVs from 20K pellets of MM patients at diagnosis and after the first-line treatment regimen.
A) (Left, middle) Thrombograms (mean ± standard deviation) depicting the outcome of EV-mediated thrombin generation before and after conventional therapy (HDCT ineligible patients) or a VCD induction therapy (HDCT eligible patients). The results on individual thrombin generation parameters are listed in the table as the means ± standard deviation including P. (Right) The effect of treatment on PPL activity of EVs ‘spiked’ into SPP, **P<0.01. The green line and area represent the reference range (mean ± SD) of the SPP. B) Size distribution (left), particle concentration (middle), and mean size (left) before and after first-line treatment as measured by the means of nanoparticle tracking analysis. All boxplots depict the median, the 25 and 75 percentiles and the whiskers min to max.

