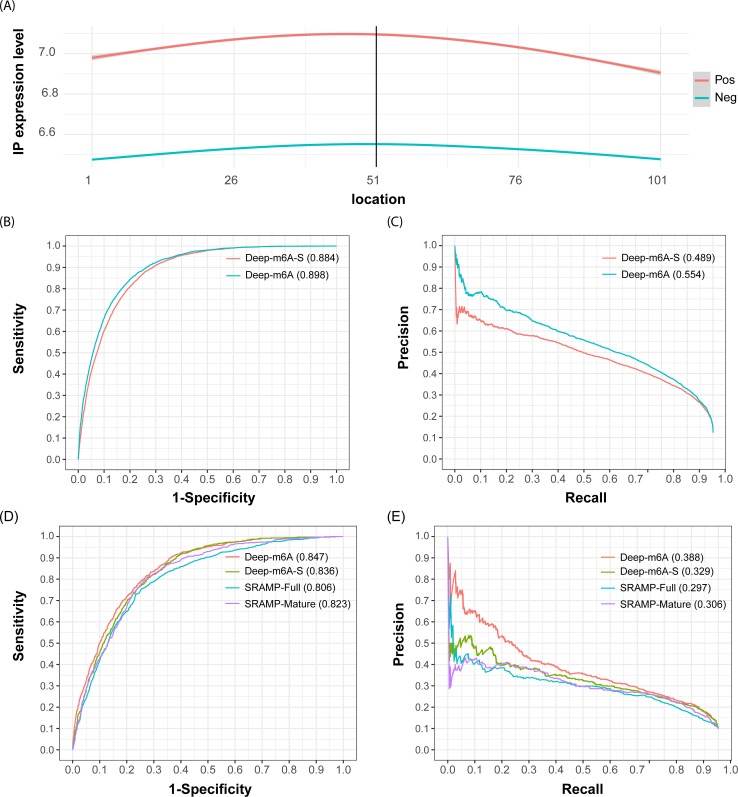
Fig 2. Performance of Deep-m6A.
(A) shows the IP reads count coverage in the 101-nt positive and negative training samples. The x-axis denotes the relative location of the nucleotides in the sample sequences, where the 51st position is the center A of the DRACH motif and the 1st position is the 5’ end of the sequence. The IP expression level represents the IP reads input RCnorm. (B) and (C) are the ROC and PR curves of Deep-m6A-S and Deep-m6A obtained from the 10-fold CV on the HEK293 training data. (D) and (E) are performances of Deep-m6A, Deep-m6A-S, SRAMP-Mature and SRAMP-Full model on the independent MOLM13 data. The number after the method names are corresponding area under the curve (AUC).

