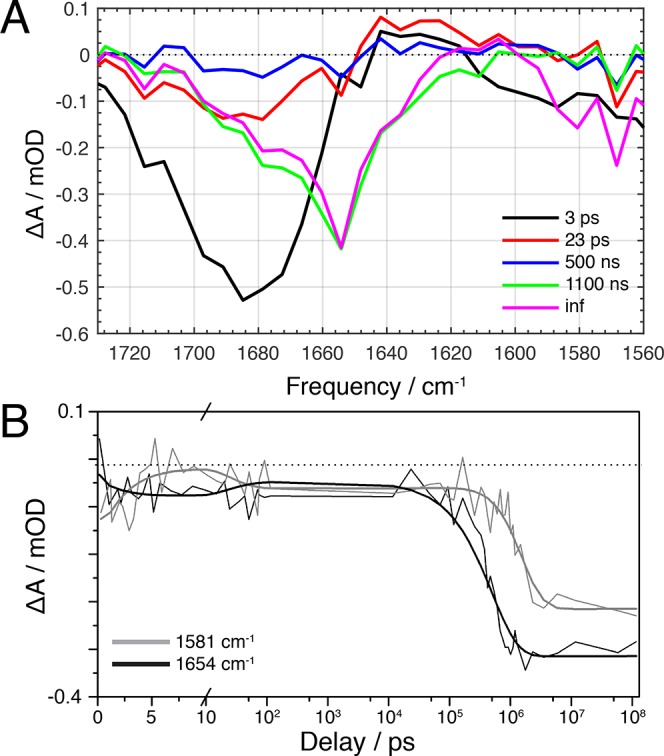
Figure 5.

(A) EADS determined from global analysis of mid-IR transient absorption data. (B) Kinetic traces at 1581 (gray) and 1654 cm–1 (black), with fitting results overlaid. The 1581 cm–1 trace was expanded by a factor 2.5 to facilitate comparison with the 1654 cm–1 trace.
