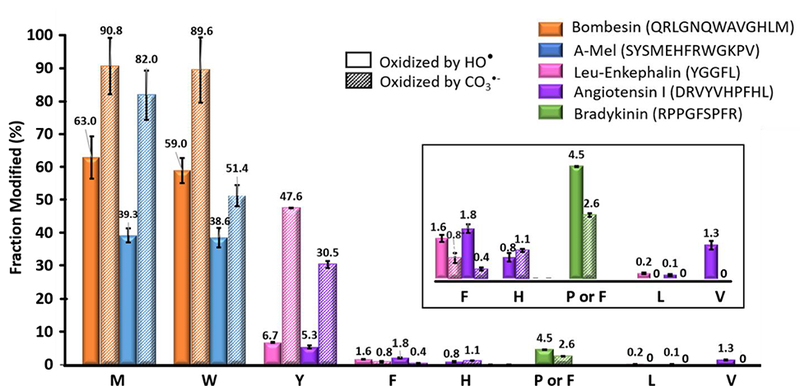
Figure 4.

Comparison of the residue-level fraction modified (in percentage) of a ‘Peptide Cocktail’ by CO3−•˙ and HO•. Different colors represent different peptides, and the sequences are shown correspondingly. Solid bars denote the HO• oxidation extent and the patterned bars denote the CO3−• oxidation. The data were corrected with respect to the negative control. Error bars are the standard deviations of three independent runs. The inset is an enlarged portion of the figure. For bradykinin, only F undergoes oxidation with CO3−•, whereas F and P oxidation are both oxidized but not distinguishable because the chromatograms of the two modified peptides overlap.
