
Figure 5.
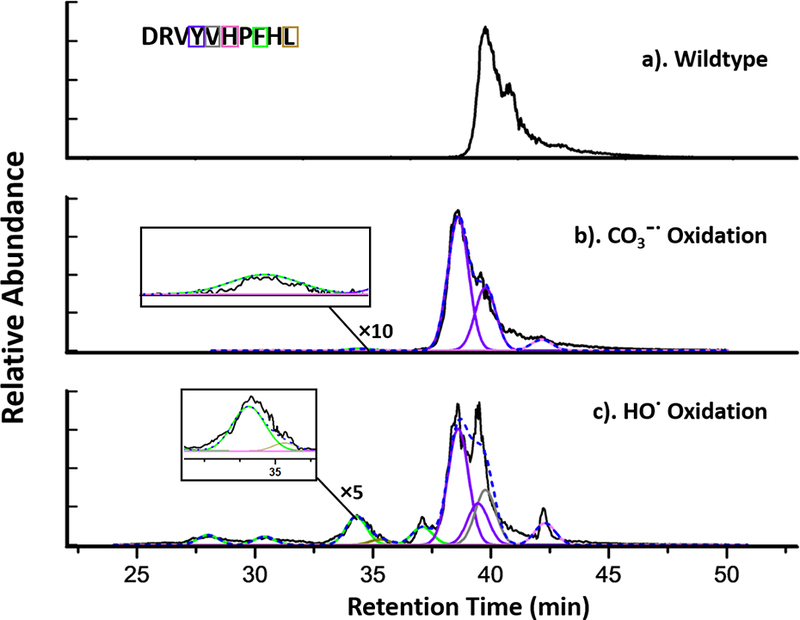
Extracted ion chromatogram (EICs) of angiotensin I wildtype (a), oxidized by CO3−• (b) and HO•. (c). Different colors (coded with the chromatogram colors) indicate differnet oxidized residues as determined by product-ion (MS/MS) spectra. Each peak is fitted by a Gaussian Function, and the overall fitting curve is presented as blue dotted line. The averaged R2 for the fitting is 0.97.