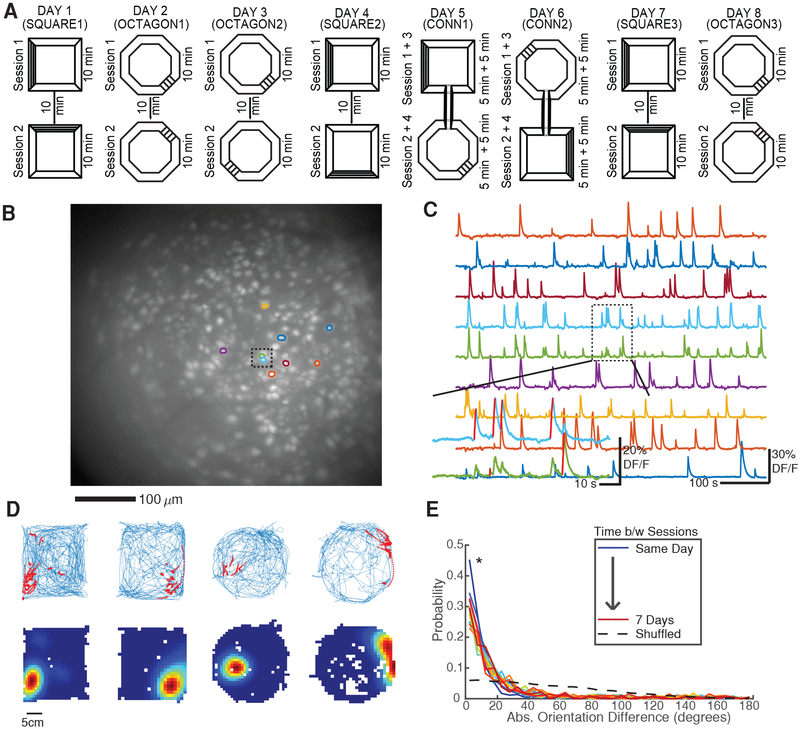
Figure 1: Experimental setup.
A) Mice explored two different arenas across 8 days. SQUARE1–3 and OCTAGON1–3: Two 10 minute sessions with arena pseudorandomly rotated between sessions. CONN1 and CONN2: Arenas were connected with a hallway and mice were given two 5 min blocks in each in alternating fashion.
B) Maximum projection from a recording session with nine neuron ROIs overlaid. Dashed box indicates two closely spaced ROIs. See also Figure S1.
C) Example calcium traces for ROIs highlighted in A. Dashed box demonstrates the ability of the cell/transient detection method to disambiguate crosstalk between neighboring neurons by assigning putative spiking epochs (red lines) to the appropriate neuron.
D) Example place fields. Top: Blue = mouse’s trajectory, red = calcium event activity. Bottom: Occupancy normalized calcium event rate maps. Red = peak calcium event rate, Blue = no calcium activity.
E) Distribution of ROI orientation (major axis angle) differences between sessions for one mouse. Since the majority of ROIs are elliptical, the small changes in ROI orientation shown here indicate that neurons are properly registered between sessions. *p < 1e-28 all session-pairs, one-sided Kolmogorov-Smirnov test vs shuffled.

