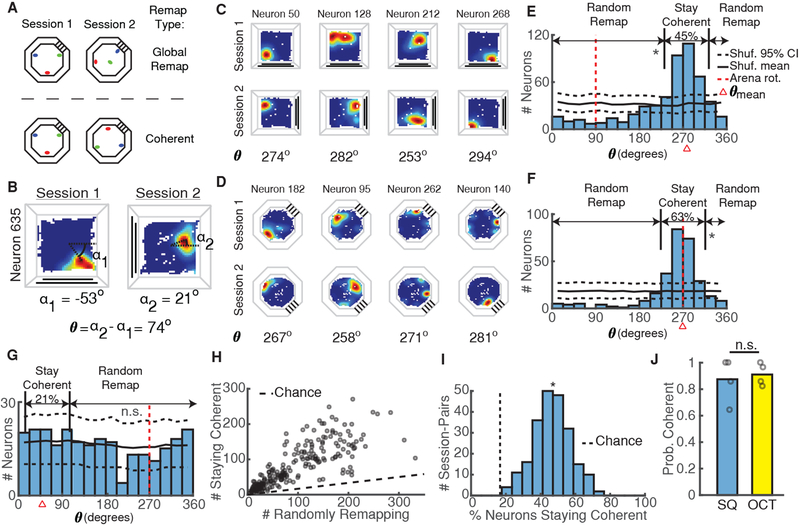
Figure 2: Coherent Maps Predominate in the Hippocampus.
A) Schematic of null hypothesis of global remapping between sessions (top) and alternate hypothesis of coherent mapping between sessions (bottom) using three example place fields (red, green, blue). In global remapping, all place fields randomly reorganize. In coherent mapping, place fields retain the same configuration but may or may not rotate.
B) The place field rotation between sessions (θ) was calculated as the difference between α1 and α2, the angle from the arena center to the occupancy bin with the peak calcium event rate in session 1 and session 2, respectively. See also Figure S2.
C) Calcium event rate maps from 4 simultaneously recorded neurons between two square arena sessions demonstrating coherent mapping. The rotation of each neuron’s place field is indicated at the bottom. Note that all rotations are close to 270 degrees.
D) Same as C, but for two octagon sessions from a different mouse.
E) Distribution of place field rotations for the coherent session-pair shown in C demonstrates clear clustering of rotations. Percentages of neurons staying coherent (|θ − θmean| < 30) or randomly remapping (|θ − θmean| >= 30) are indicated above the distribution. Black solid/dashed lines = shuffled mean and 95% CI. Red dashed line = arena rotation. Red triangle = θmean. *p < 0.001, shuffle test.
F) Same as E, but for the coherent session-pair shown in D. *p < 0.001.
G) Same as E-F but for an infrequent session-pair exhibiting global remapping. p = 0.15.
H) Number of neurons staying coherent versus randomly remapping for all session-pairs. Dashed line indicates numbers expected by chance.
I) Percentage of neurons whose place fields stay coherent for all mice/session pairs. *p = 1.8e-108 (t-test vs chance).
J) Probability of using a coherent map in each arena. Open circles indicate proportions for each mouse. p = 1, Wilcoxon rank-sum test.

