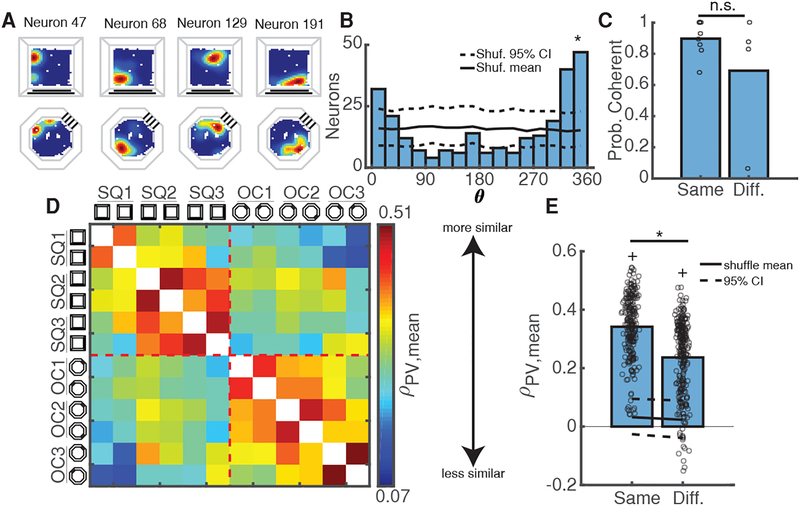
Figure 4: Coherent Maps Generalize Across Different Environments.
A) Calcium event maps from 4 simultaneously recorded neurons indicate place fields stay in the same location between arenas.
B) Distribution of place field rotations for coherent session-pair shown in A. Black solid/dashed lines = shuffled mean and 95% CI. *p < 0.001, shuffle test.
C) Probability of using a coherent map remains high within and between arenas. Open circles = mean for each mouse/comparison-type. *p = 0.48, Wilcoxon rank-sum test.
D) Mean population vector (PV) similarity between all non-connected sessions in each arena, grouped by arena and averaged across mice. Warmer/cooler colors indicate higher/lower PV similarity between sessions. See also Figure S4A.
E) PVs are more similar within arenas than between arenas. Open circles indicate mean PV correlations for all mice/session-pairs. Black solid/dashed lines = shuffled distribution mean and 95% CI. *p = 1.3e-28 Wilcoxon rank-sum test. +p < 1e-37, sign-rank test vs upper 95% CI.

