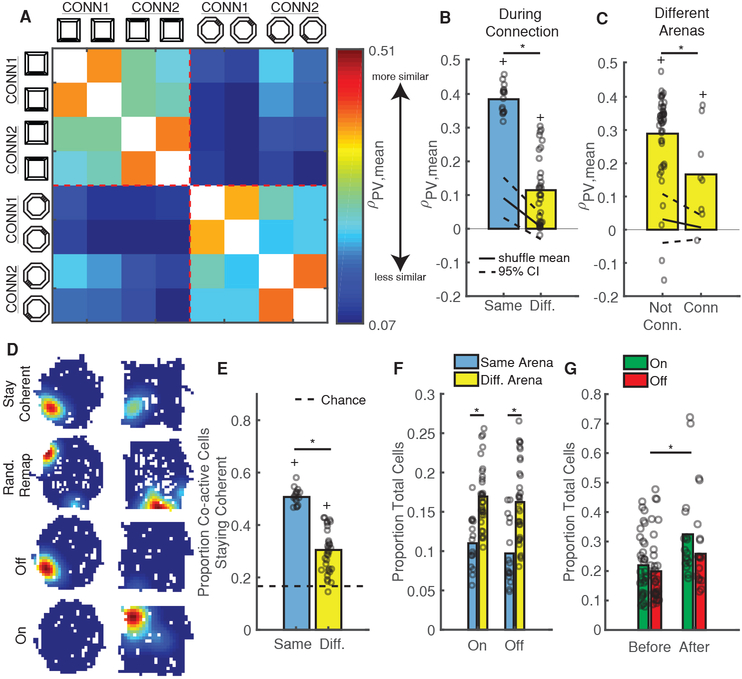
Figure 5: Connecting Arenas Temporarily Sharpens Discrimination.
A) Mean PV similarity on connected days, grouped by arena and averaged across mice. Same color scale as Figure 4D. See also Figure S4B.
B) PVs are more similar within arenas (blue) than between arenas (yellow) during connection. Open circles are for all mice/session-pairs. Black solid/dashed lines = shuffled distribution mean and 95% CI. *p = 2.3e-8, Wilcoxon rank-sum test. +p < 0.001, sign-rank test vs upper 95% CI.
C) PV similarity between arenas on un-connected days are higher than on connected days. Same conventions as B. All session-pairs considered were 1 day apart. *p = 0.041, Wilcoxon rank-sum test. +p < 0.04, sign-rank test vs upper 95% CI.
D) Example event rate maps for neurons that either stay coherent, randomly remap, turn “off” (active in 1st arena, inactive in 2nd), or turn “on” (inactive in 1st arena, active in 2nd) between arenas.
E) The size of the population staying coherent decreases between arenas. Open circles indicate proportions for all mice/session-pairs during connection. Black Dashed black line = chance. *p=2.3e-8, Wilcoxon rank-sum test. +p = 2.3e-8 sign-rank test vs chance.
F) More neurons turn on/off between different arenas than within the same arena. Same conventions as E. *p < 2e-4, Wilcoxon rank-sum test.
G) Arena connection induces a lasting increase in the number of on/off neurons. Same as F but for session-pairs before and after connection. *p = 0.026, Wilcoxon rank-sum test.

