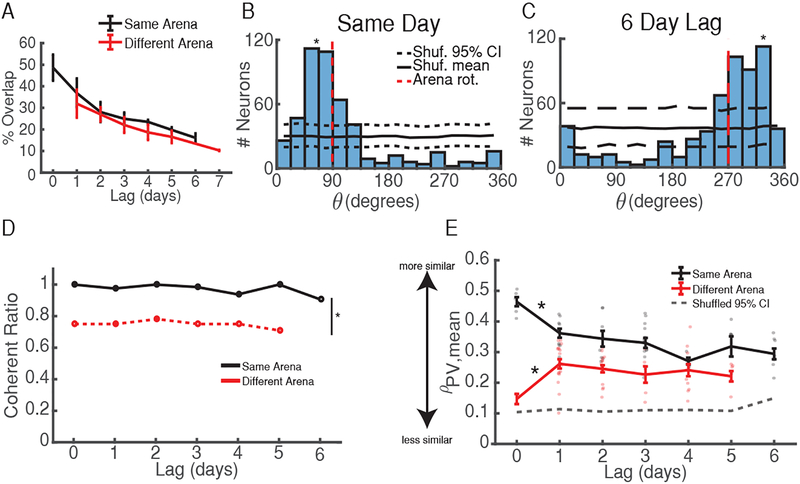
Figure 6: Properties of Activity Across Long Time Scales.
A) % Cell overlap vs. time lag between sessions demonstrates that fewer neurons are reactivated with time. Data are shown as mean ± s.e.m. Black = same arena, red = different arena.
B) θ distribution for session-pair occurring the same day. Black solid/dashed lines = shuffled mean and 95% CI. Red dashed line = arena rotation. *p < 0.001, shuffle test.
C) θ distribution for session-pair occurring 6 days apart. Same conventions as B. *p < 0.001.
D) Time does not influence the probability of maintaining a coherent map between sessions. p > 0.5 Kruskal-Wallis ANOVA for same (black) and different (red) arena session-pairs across time. *p = 6.5e-5 Wilcoxon rank-sum test.
E) High PV correlations at ~θmean supports the use of coherent maps at all time lags between sessions. Grey dashed = upper 95% CI from shuffled distribution. Colored dots indicate mean for each session-pair across mice. Error bars = s.e.m. *p < 0.001, Wilcoxon rank-sum test vs upper 95% CI at all time lags. See also Figure S5.

