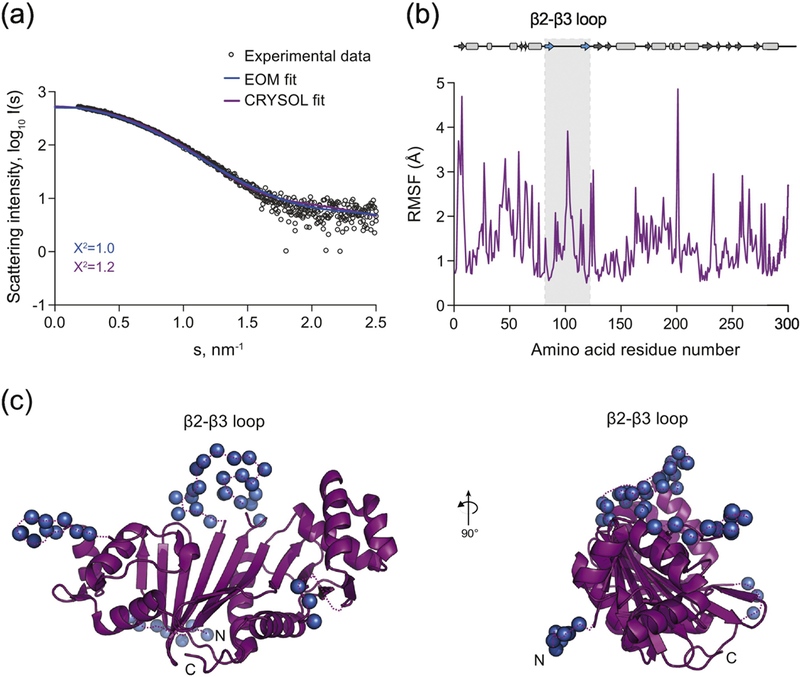
Figure 5. Solution structure of EspG5mtu.

(a) Experimental SAXS data (black circles) and computed fits (solid lines) with respective discrepancy values (χ2). The theoretical SAXS curve of the EspG5mtu crystal structure when in complex with PE25/PPE41 as calculated using CRYSOL (purple) (PDB ID 4KXR, chain C) fits the experimental SAXS data with a χ2 of 1.2 and an apparent misfit around s = 1.8 – 2.0 nm-1. To calculate the EOM fit, the 24 amino acid residues that were missing from the crystallographic structure of EspG5mtu were added at the N-terminus and flexibility of all loops was allowed. This procedure resulted in an improvement of the fit to a χ2 value of 0.99 (blue). (b) The amino acid residue root-mean- square-fluctuation (RMSF) of EspG5mtu (starting structure PDB ID 4KXR, chain C) during a molecular dynamics simulation run. The secondary structure assignment of the crystallographic structure is shown above the RMSF plot for reference, where β-sheets and α-helices are represented by arrows and rectangles, respectively. (c) The flexible loop regions and the amino acid residues missing from the crystallographic structure of EspG5mtu crystal structure when in complex with PE25-PPE41 (purple) are modeled as dummy residues (blue spheres).
