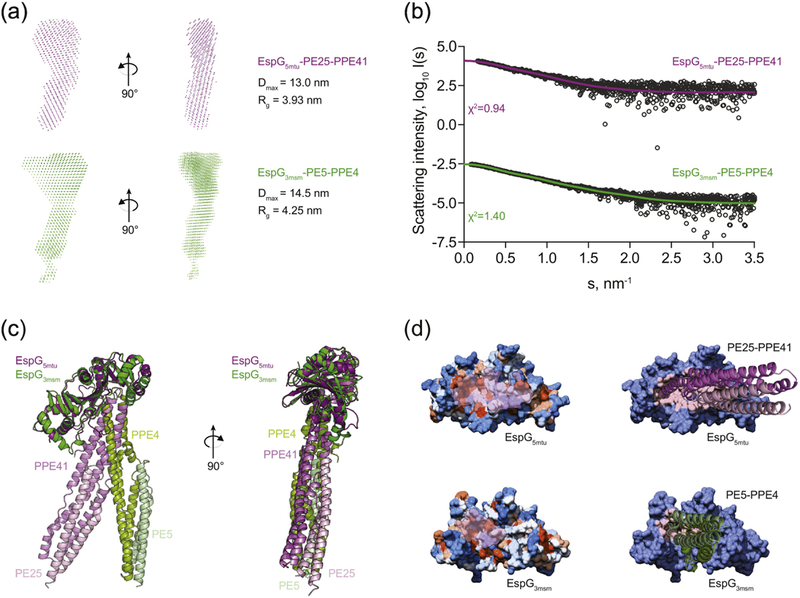
Figure 6. Comparison of EspG5-PE25-PPE41 and EspG3-PE5-PPE41−178 complexes structures.

(a) SAXS-based ab initio models of the EspG5mtu-PE25-PPE41 complex (purple) and the EspG3msm-PE5–PPE41−178 complex (green) reveal a more extended conformation of the EspG3msm-PE5–PPE41−178 complex, as indicated by the maximum diameter (Dmax) and radius of gyration (Rg) of each complex. (b) Experimental SAXS data (black circles) with the computed fits (solid lines) and the respective discrepancy values (χ2) for EspG5mtu-PE25- PPE41 and EspG3msm-PE5-PPE4 protein complexes. The theoretical SAXS curve, calculated with CRYSOL from the EspG5mtu-PE25–PPE41 complex structure (PDB ID 4KXR), fits the experimental SAXS data with a goodness-of-fit (χ2) of 0.95 (purple). The theoretical SAXS curve calculated from the EspG3msm rigid-body model in complex with a homology model of PE5-PPE41−178 fits the experimental SAXS data (green) with a goodness- of-fit values (χ2) of 1.40. (c) Superposition of the crystal structure of EspG5mtu-PE25-PPE41 (purple-lilac-light pink) and the SAXS-derived rigid body model of EspG3msm-PE5-PPE41−178 (dark green-light green-light blue). (d) Hydrophobicity surface representation of EspG proteins with PPE-interacting surface highlighted in transparent pink (left panel). Interaction interface of EspG5mtu-PPE41 and EspG3msm-PPE4, with PPE-PE proteins represented as cartoon and EspG proteins as surface with the contact residues in the interface colored in light pink in each EspG protein (right panel).
