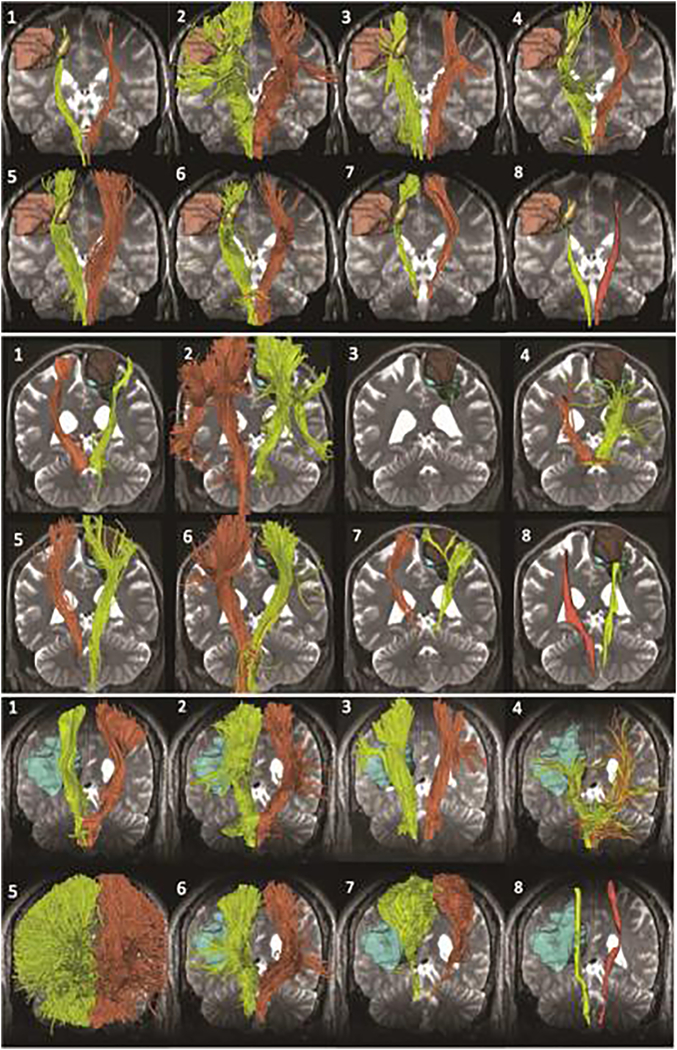
Figure 3.

There are limitations to the use of tractography in clinical decision making - reconstruction of the CST results in a number of false positive and false negative connections. The figure shows eight tractography reconstructions of the pyramidal tract for patient 2 (top), patient 3 (center), and patient 4 (bottom). Each view presents the tracts (yellow: tumor side; orange: contralateral side) overlaid on axial and coronal T2-weighted image. Reproduced from Pujol et al. (2105) with permission from Wiley.
