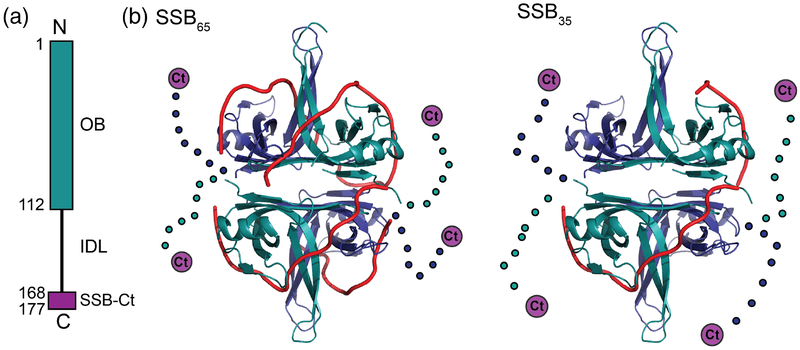
Figure 1. Bacterial SBB structure.
(a) Schematic diagram of a bacterial SSB. The N-terminal OB domain is shown along with the C-terminal IDL and the SSB-Ct (purple). (b) Ribbon diagrams of E. coli SSB65 (left) and SSB35 (right) ssDNA binding models[19]. The OB domains are shown in blue or teal, the IDL is shown schematically as dots, and the SSB-Ct is depicted as a purple circle, with ssDNA in red.

