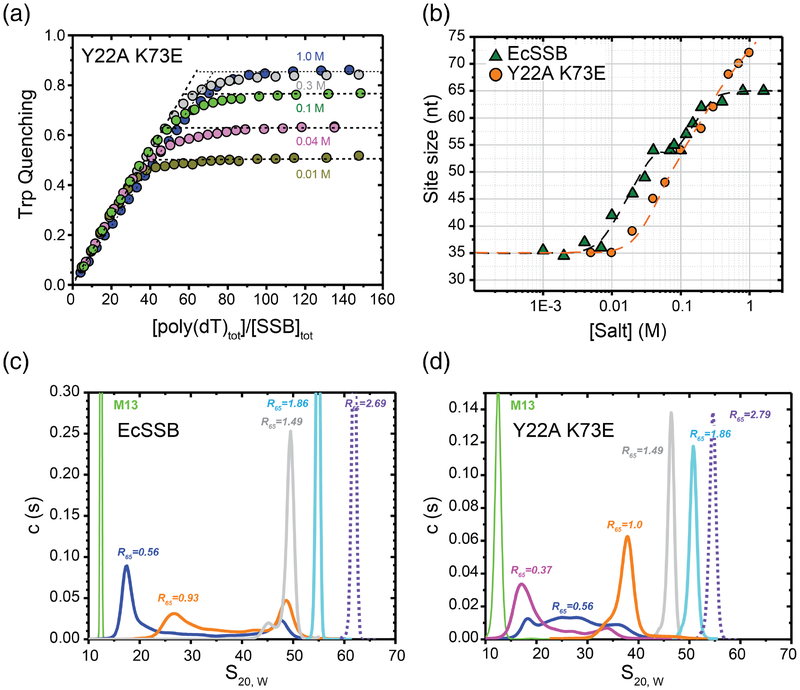
Figure 7. ssDNA binding properties of EcSSB versus the EcSSB Tyr22Ala Lys73Glu mutant.
(a) Occluded site sizes (nucleotides per tetramer) on poly(dT) plotted as a function of [NaCl] for the EcSSB Tyr22Ala Lys73Glu variant (orange circles) determined from analysis of stoichiometric titration curves, examples of which are shown in panel (b) (occluded site sizes for EcSSB from [24] are shown for comparison (green triangles). (b) Representative reverse equilibrium titrations of EcSSB Tyr22Ala Lys73Glu (0.2μM) with poly(dT) (monitoring intrinsic Trp fluorescence quenching) at different NaCl concentrations: 10mM – dark yellow, 40 mM – magenta, 100 mM – green, 300 mM – grey and 1 M – blue. The occluded site sizes were determined as described [57]. (c) and (d) Sedimentation coefficient distributions, c(s20,W), for EcSSB (c) and EcSSB Tyr22Ala Lys73Glu (d), in complex with M13 ssDNA in 10 mM NaCl at different protein to DNA ratios, R65, where R65=[SSBtetr, tot]×65/[M13ssDNAnts, tot]. Data were analyzed as described [10].

