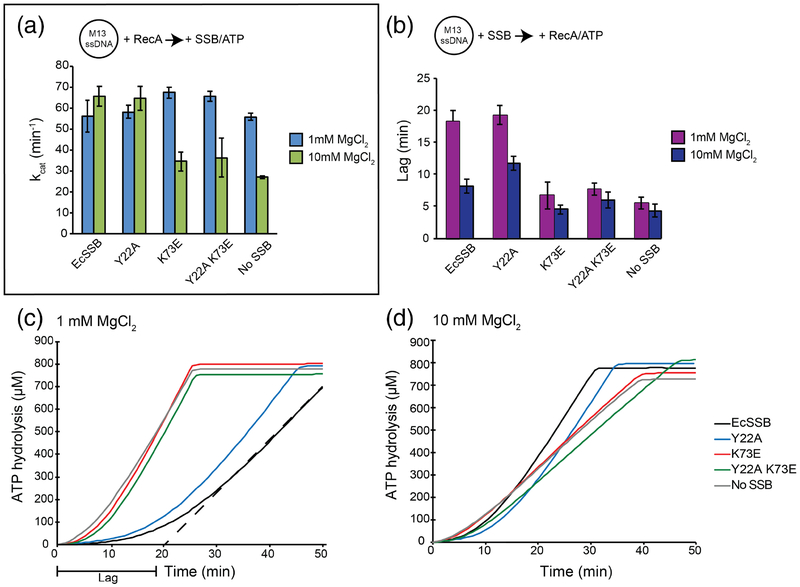
Figure 8. DNA-dependent ATPase activity and lag periods of RecA in the presence of SSB interface variants.
(a) M13 ssDNA was preincubated with RecA. After addition of ATP and SSB, ATP hydrolysis rates (kcat) were measured. Bar graph depicts the mean of three experiments with error bars representing the standard deviation. (b) M13 ssDNA preincubated with SSB was analyzed for a lag in ATP hydrolysis after the addition of ATP and RecA. Bar graph depicts the mean of three experiments with error bars representing the standard deviation. (c) and (d) Representative graphs of RecA lag periods with different SSB variants at 1 mM MgCl2 (c) 10 mM MgCl2 (d) concentrations. Representative dashed line in (c) depicts lag period calculation.

