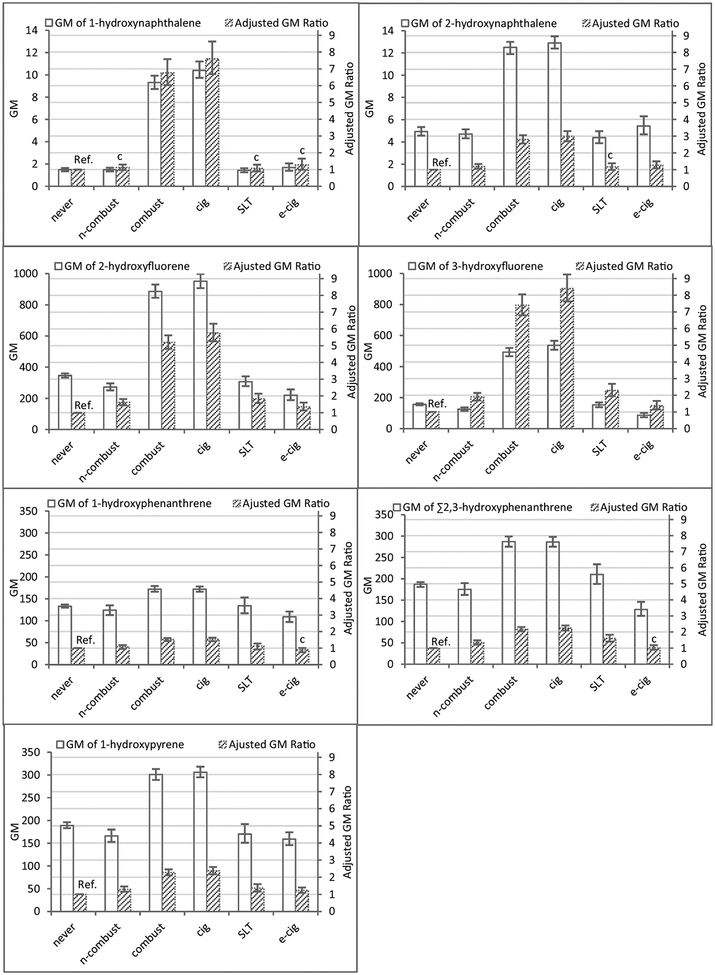
Fig. 1.
Geometric mean (GM) biomarker concentrations (95% CI)a and adjusted geometric mean ratios (95% CI) from ANCOVA model (never user as reference)b,c by tobacco user groupsd and specific tobacco-product user groupse, PATH Study Wave 1 (2013–2014).
aGM concentration in μg/L for 1-hydroxynaphthalene and 2-hydroxynaphthalene; in ng/L for the rest of the biomarkers; error bars display the 95% confidence intervals.
bAdjusted for log10(creatinine), race/ethnicity, sex, and age.
cRelative standard error (RSE) > 30% (CDC, 2002).
dThree main tobacco user groups: never user (never), non-combustible products user (n-combust), and combustible products user (combust) are mutually exclusive.
eFour specific tobacco-product user groups: never user (never), e-cigarette user (e-cig), SLT user (SLT), and cigarette user (cig) are mutually exclusive.

