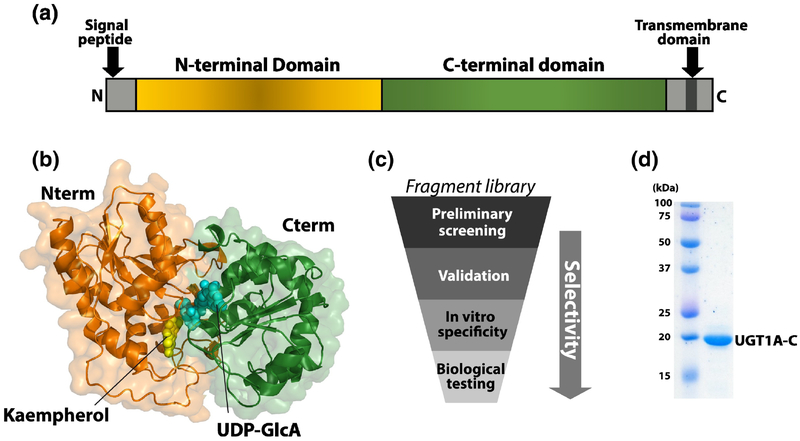
Figure 1.
Characterization of UGT1As. (A) Schematic of domain structure of UGT1A enzymes. (B) Model of full-length UGT1A4 protein. UDP-GlcA (blue) and the substrate kaempherol (yellow) from the original VvGT1 x-ray structure (pdb 2C1Z [26]) are shown. Each subdomain is represented in the same color as in panel A. (C) Schematic of workflow for development of selective glucuronidation inhibitors. (D) UGT1A-C protein after purification by Coomassie blue stained SDS-PAGE gel. Molecular weight markers are shown.

