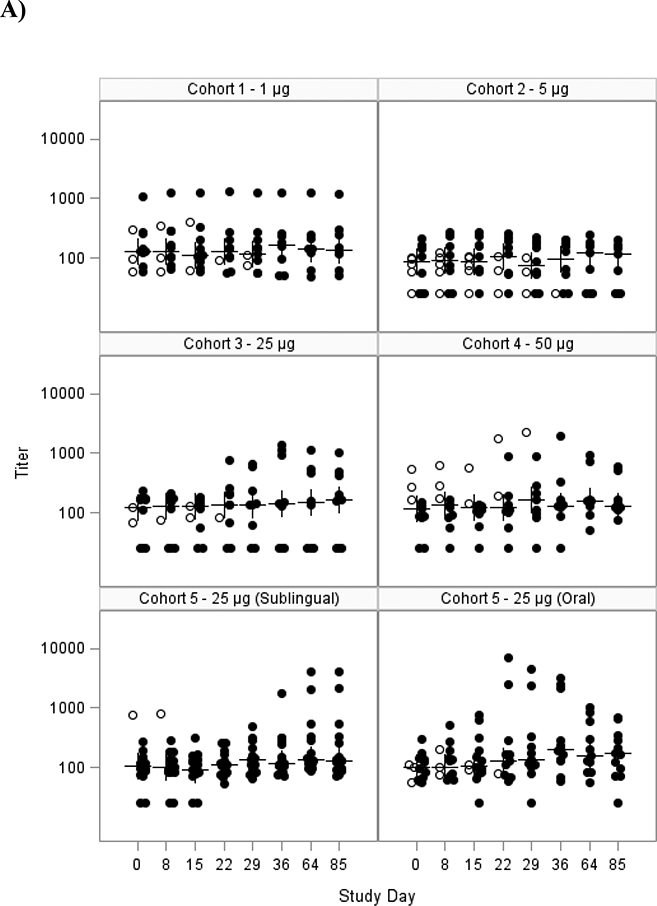
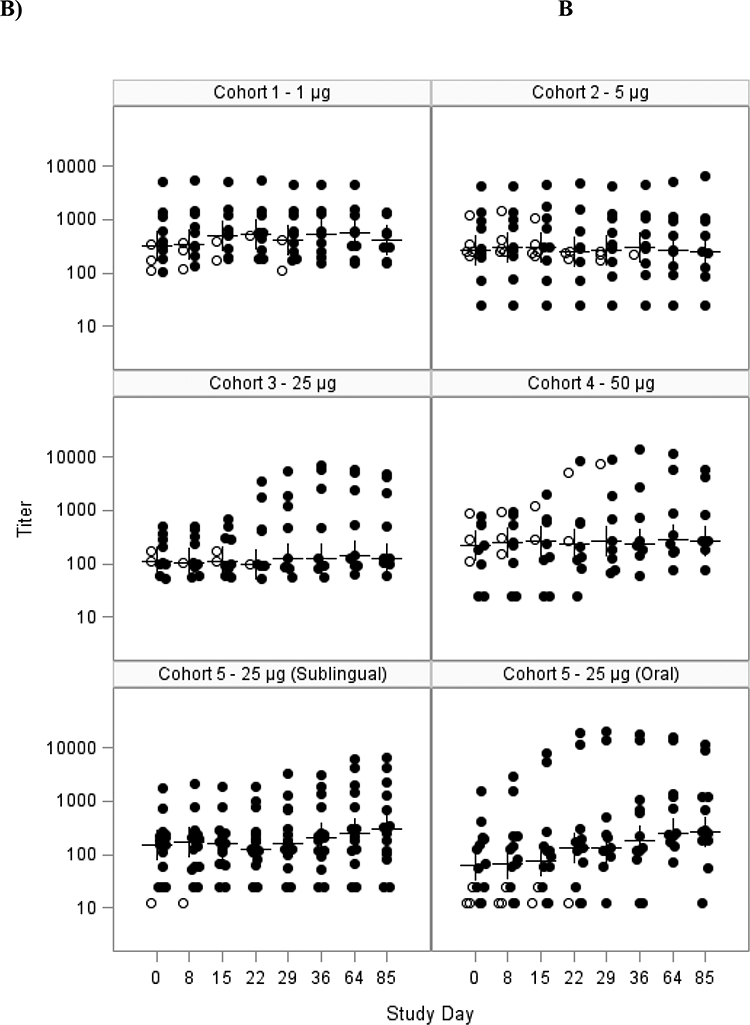
Figure 2: Serum anti-dmLT IgA (A) and IgG (B) titers as measured by ELISA, mITT population.


Scatter plot showing the A) log10 serum IgA antibody response to dmLT for each subject in the mITT population for each cohort and B) log10 serum IgG antibody response. Cohorts 1–4 received SL dmLT. Cohort 5 was randomized to receive SL or Oral dmLT.
The closed circles are individuals who received all 3 doses; the open circles are individuals that received <3 doses. The crosses represent the median at each time point. Subjects were vaccinated on days 0, 15 and 29.
