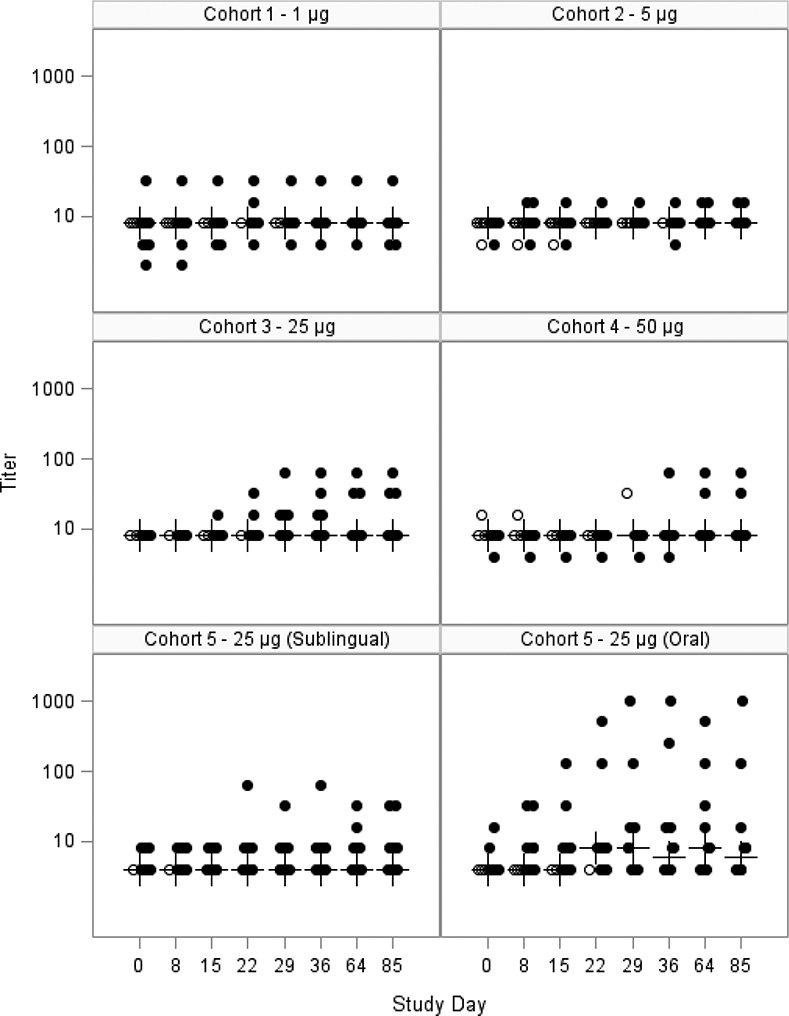
Figure 3: Serum LT-neutralization GMT, mITT Population.

Scatter plot showing the log10 serum neutralizing antibody response to dmLT for each subject in the mITT population for each cohort. The closed circles are individuals who received all 3 doses; the open circles are individuals that received <3 doses. The crosses represent the median at each time point. Subjects were vaccinated on days 0, 15 and 29.
