
FIGURE 1. Assessment of Treatment Efficacy.
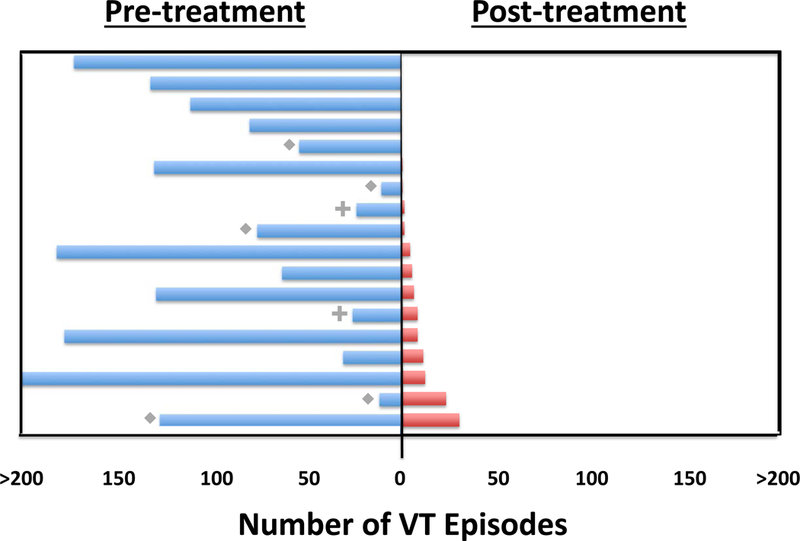
There were 18 patients who survived to 6 months. Patients with incessant VT or sustained slow VT below the ICD detection rate are noted with a diamond (n=5); these episodes were not included in the total. Patients with PVC-mediated cardiomyopathy are noted with a plus (n=2) and displayed as the PVC burden (percentage) captured on a 24 hour Holter monitor. Each line represents an individual patient; blue lines indicate pre-ablation and red lines post-ablation. Upper boundaries are artificially truncated at 200 episodes. Patients are arranged by recurrences during follow-up, ranging from greatest (bottom) to least (top). Frequency of VT was significantly reduced from a median of 119 episodes in the 6 months pre-ablation to a median of 3 episodes in the post-blanking period through 6 months (p < 0.001). For 2 patients with PVC-related cardiomyopathy, 24-hour PVC burden reduced from 24% to 2% and 26% to 9%. The frequency of VT episodes or PVC burden was reduced by 75% in 89% of patients. VT = Ventricular tachycardia, ICD = Implantable Cardioverter Defibrillator, PVC = Premature ventricular contraction