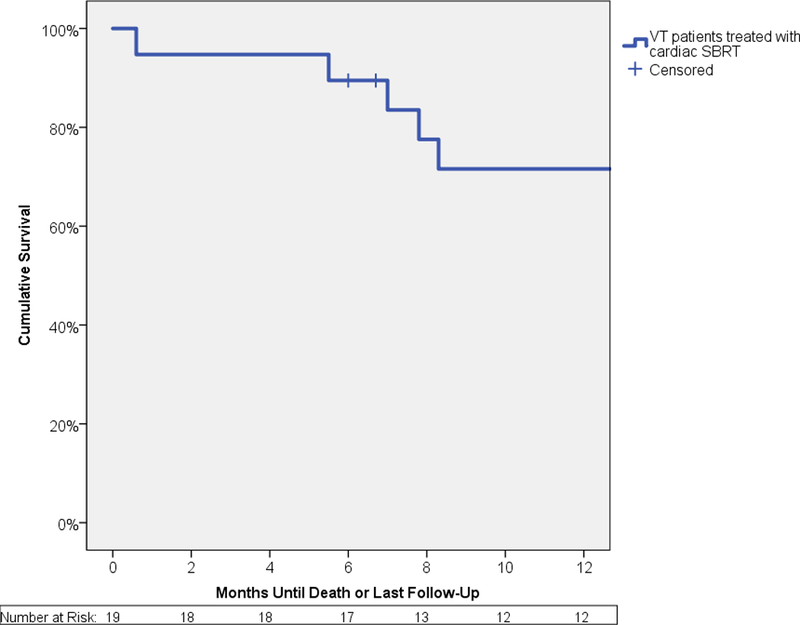
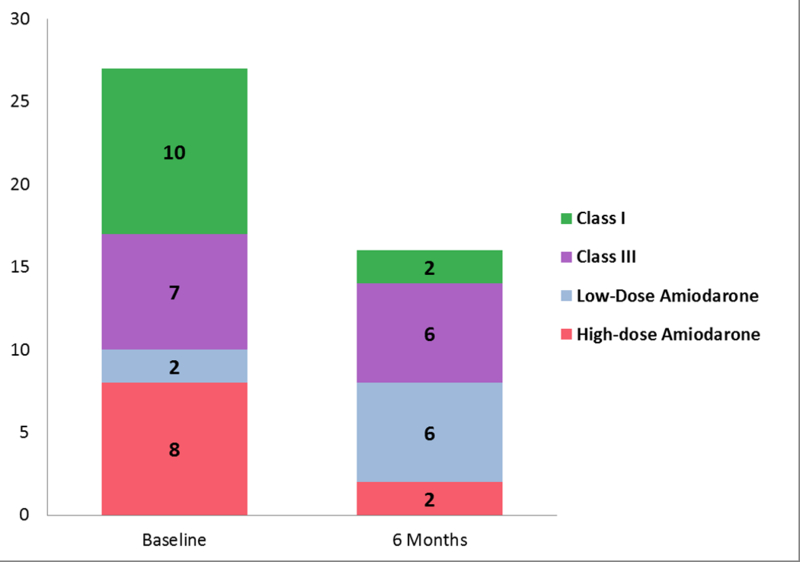
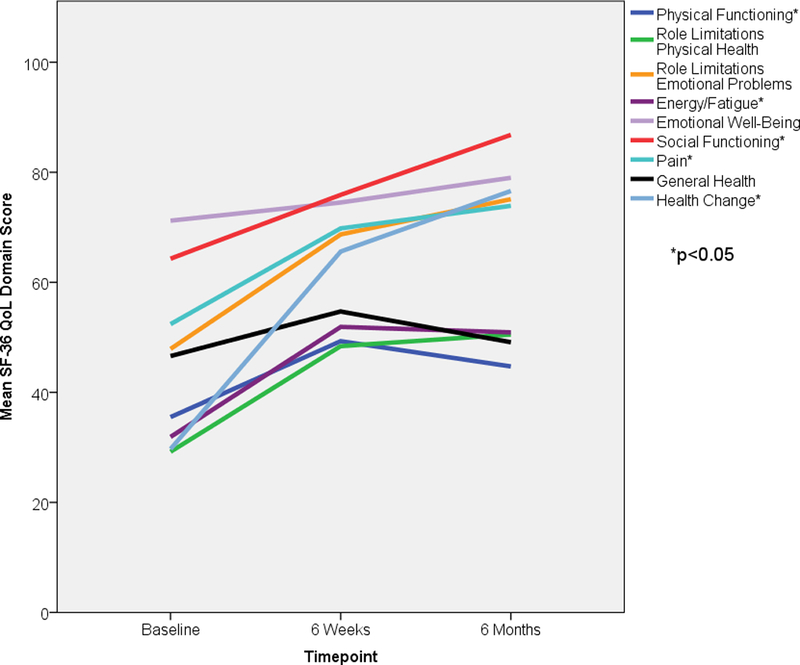
FIGURE 2. Summary of Select Secondary Endpoints.


Panel A shows a Kaplan-Meier curve of overall survival for all patients. Actuarial overall survival at 6 months was 89% and 12 months was 72%. Panel B shows a stacked bar graph of anti-arrhythmic medication usage in patients, at baseline and at 6 months after treatment. The y-axis represents the total number of anti-arrhythmic medications used, with the sizes of each color being directly proportional to the number of agents used in that particular class of anti-arrhythmic medication. Amiodarone usage is split into high dose (≥300 mg/day) and low dose (<300 mg/day). Class I agents consisted of mexiletine and flecainide. Class III agents consisted of sotalol. Panel C graphically represents mean scores reported by the 16 patients who were alive at 6 months at baseline, 6 weeks, and 6 months after treatment in 3 selected domains of the Short Form-36 questionnaire – Social Functioning in blue, Health Change in green, General Health in purple. Asterisks denote a significant change (p<0.05) in mean scores over time. VT = Ventricular tachycardia, SBRT = Stereotactic Body Radiotherapy. Figure 2A – Overall Survival for All Patients Underdoing Noninvasive Cardiac Radioablation. Figure 2B - Antiarrhythmic Medication Use. Figure 2C – Select Short Form-36 Quality of Life Measures
