FIGURE 1.

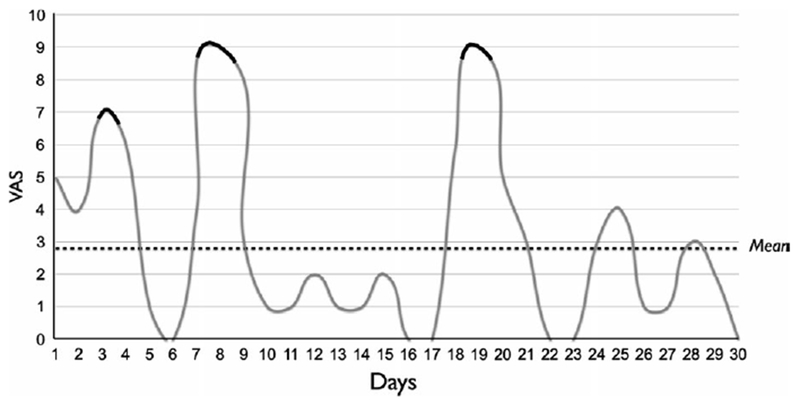
Variation of pain intensity in a 1-month period. The highest peaks of pain intensity are highlighted in black, those are the moments during which the patient sought treatment. VAS, visual analogue scale

Variation of pain intensity in a 1-month period. The highest peaks of pain intensity are highlighted in black, those are the moments during which the patient sought treatment. VAS, visual analogue scale