
Fig. 2. Metabolome-wide-association study (MWAS) of lung Cd content showed affected metabolome in mouse lung.
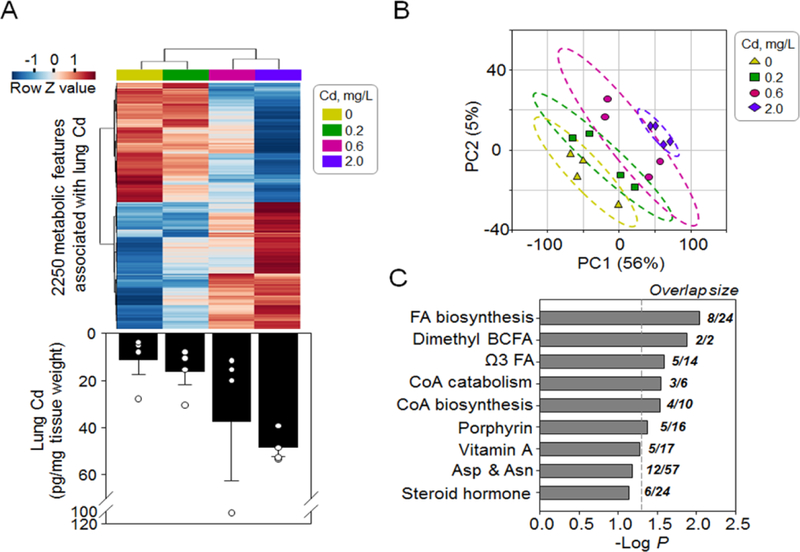
Normalized average levels of 2,250 metabolites (A, top) associated with (P < 0.05, linear regression) increased lung Cd content (A, bottom, a bar graph replotted from Fig 1C) were separated in a dose-dependent manner by hierarchical cluster analysis (A) and partial least square discriminant analysis (B). Pathway enrichment analysis (C) showed affected metabolic pathways enriched by the 2,250 metabolites. Asterisk indicates difference from control tested by student’s t test; * P < 0.05.