
Figure 3.
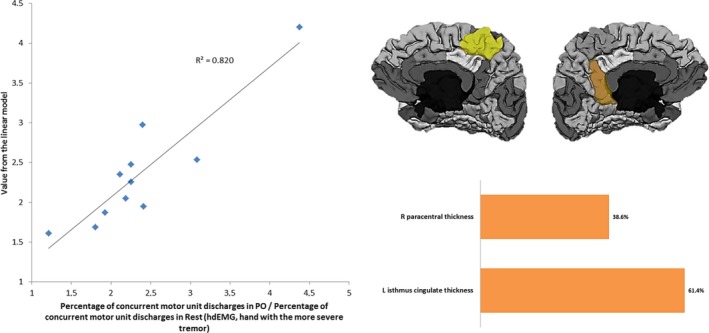
Left: Linearly modeled versus actual values of the percentage of concurrent motor unit discharges in PO task normalized to RE in the hand with the more severe tremor. Right: Cortical areas comprising the descriptive model and their relative contribution. L: Left hemisphere; R: Right hemisphere.