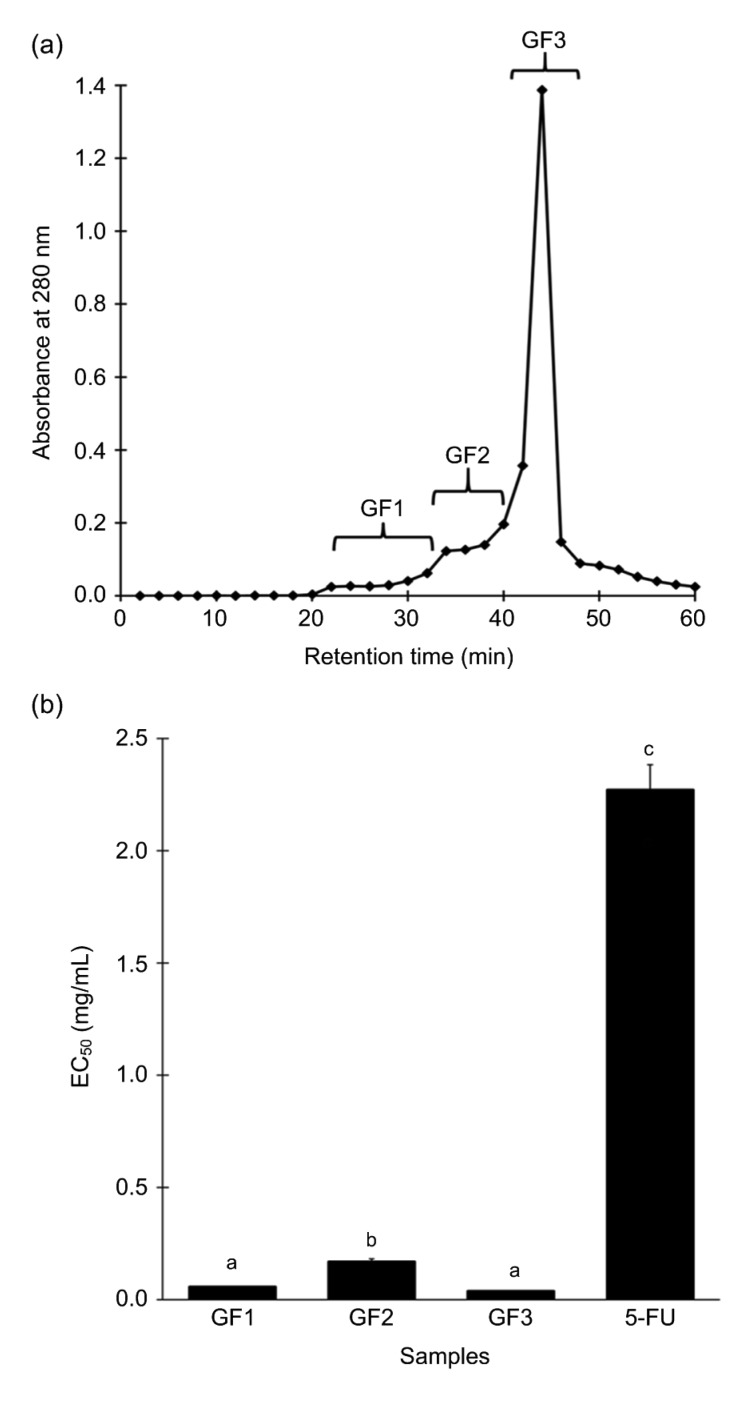
Fig. 3.
Gel filtration chromatography of <3 kDa UF
(a) A representative elution profile. Eluates were divided into three pooled fractions, GF1, GF2, and GF3. (b) Cytotoxicity of the GF fractions and 5-FU, expressed as EC50 values. For (b), data are expressed as mean±SE (n=3). Data labelled by different letters are significantly different (P<0.05) according to the Fisher’s LSD test

