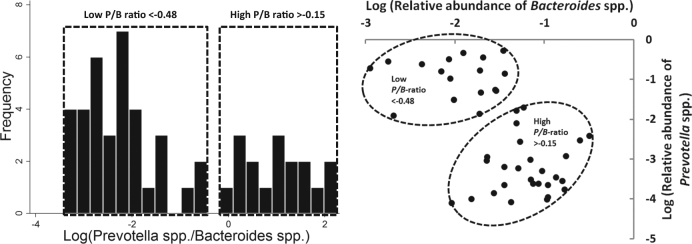
Fig. 1.
Identifying three distinct Prevotella-to-Bacteriodes groups Before the intervention participants were observed to form two distinct groups based on the log-transformed relative abundance of Bacteroides spp. and the log-transformed relative abundance of Prevotella spp. indicated with dotted lines and referred to as low (n = 27) and high (n = 17) Prevotella-to-Bacteriodes (P/B) groups. Participants with no detectable Prevotella spp., referred to as the 0-Prevotella group, constitute the third group (n = 8) but was excluded from this figure

