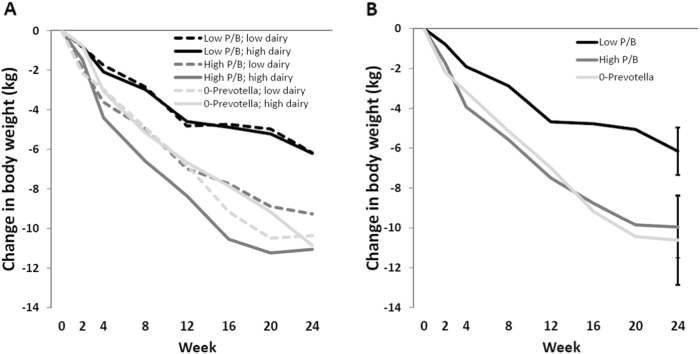
Fig. 2. Change in body weight (a) between and (b) within diets when stratified into three groups according to Prevotella-to-Bacteroides (P/B) ratio.
Data are presented as estimated mean weight change from baseline for each combination of the (a) diet-time-P/B strata interaction or (b) time-P/B strata interaction in the linear mixed models, which were additionally adjusted for age, gender, baseline BMI, fasting glucose, fasting insulin, (also diet allocation in panel b), and subjects. Differences in weight change from baseline were compared after 24 weeks through pairwise comparisons using post hoc t-tests and presented as mean weight change from baseline with 95% confidence intervals. No difference in weight change was observed between the two diets (low and high dairy) within any of the three P/B groups (all P ≤ 0.23) (see panel a). For clarity, confidence intervals were omitted from panel a. The two different diets were collapsed and differences in weight change between the three P/B groups were compared after 24 weeks (see panel b) § indicate significant difference between the low P/B group and each of the high P/B and 0-Prevotella group (both P < 0.001)

