FIGURE 1.

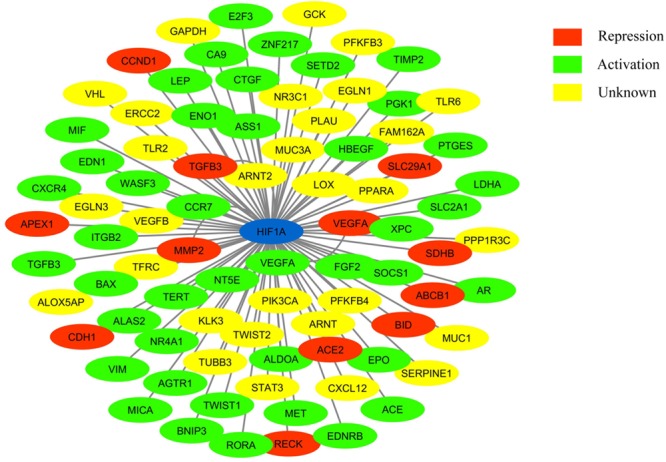
Network showing HIF-1 connected to its target genes (adapted from: http://www.grnpedia.org/trrust/). Colors inside the shape represent the type of interaction.

Network showing HIF-1 connected to its target genes (adapted from: http://www.grnpedia.org/trrust/). Colors inside the shape represent the type of interaction.