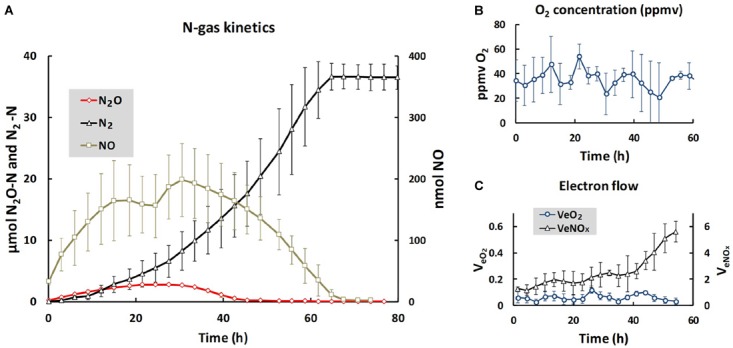
FIGURE 1.

Gas kinetics and electron flow throughout the entire incubation. (A) Shows the average amounts of N-gasses per vial: nmol NO (right axis), μmol N2O- and N2-N (left axis). (B) Shows the average O2 concentrations (ppmv = uL O2 L-1), and (C) shows the electron flow to terminal oxidases (VeO2) and to denitrification (VeNOx), both as μmol e- vial-1 h-1. Bars indicate standard deviation (n = 3). For N2O (A), the standard deviations are too low to be visible. The low and near constant electron flow to terminal oxidases was sustained by the O2 leakage through the injection system, which was 50 nmol O2 per sampling ( = 16 nmol h-1, since the vials were sampled every 3 h). Note that the scale for VeO2 is one 10th of the scale for VeNOX, thus VeO2 was approximately 5% of VeNOx during the first 10 h of incubation. Given the fluctuation of oxygen concentrations between 20 and 50 ppmv, the equilibrium concentration of O2 in the soil moisture fluctuated between 30 and 75 nM [solubility of oxygen at the incubation temperature (15°C) is 0.0015 mol L-1 atm-1].
