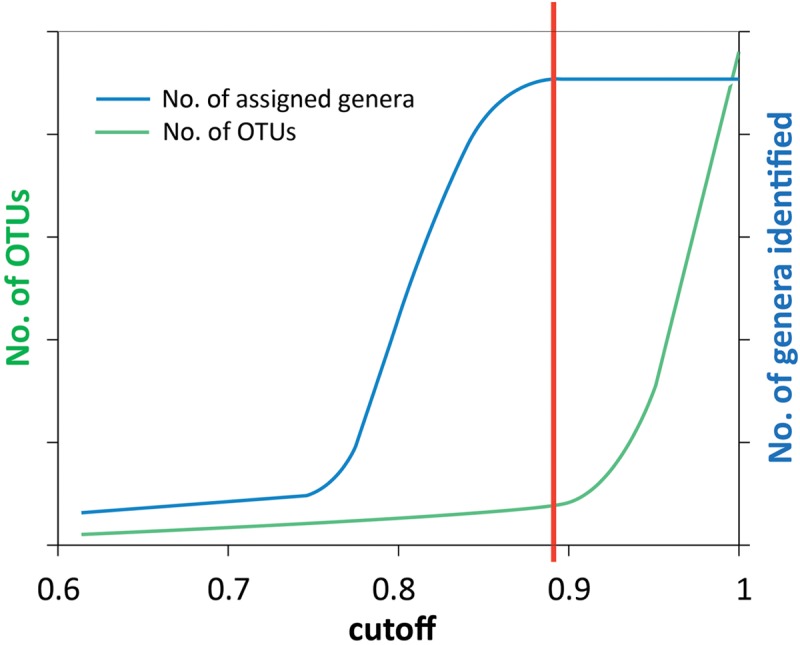
FIGURE 2.

Schematic illustration of how the similarity threshold value for defining OTUs was chosen. The reads were clustered into OTUs at a number of cutoff values ranging from 0.6 to 1. Taxonomy assignment was also performed at each cutoff value. By plotting the number of assigned genera (blue curve) and the number of OTUs (green curve) against the cutoff values, the point where the number of genera is saturated (red line) was chosen as the threshold value to define OTUs. This method was used for all genes analyzed in this study, and the results are shown in Supplementary Figures S1–S6.
