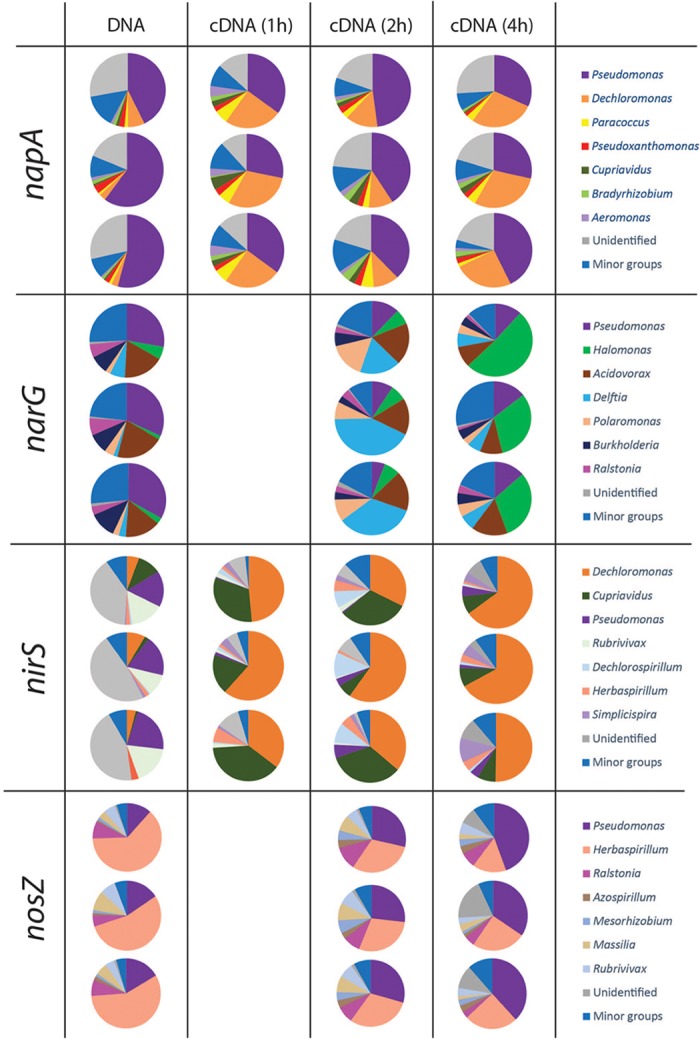
FIGURE 4.

Microbial community structure and shifts in the actively denitrifying populations, revealed by phylogenetic composition analysis of the DNA and cDNA of narG napA nirS and nosZ genes. The three pie charts in the same box are three replicates. No gene transcription was detected at 1 h for nosZ and narG genes. The phylogenetic composition of the minor groups is shown in Supplementary File S2.
