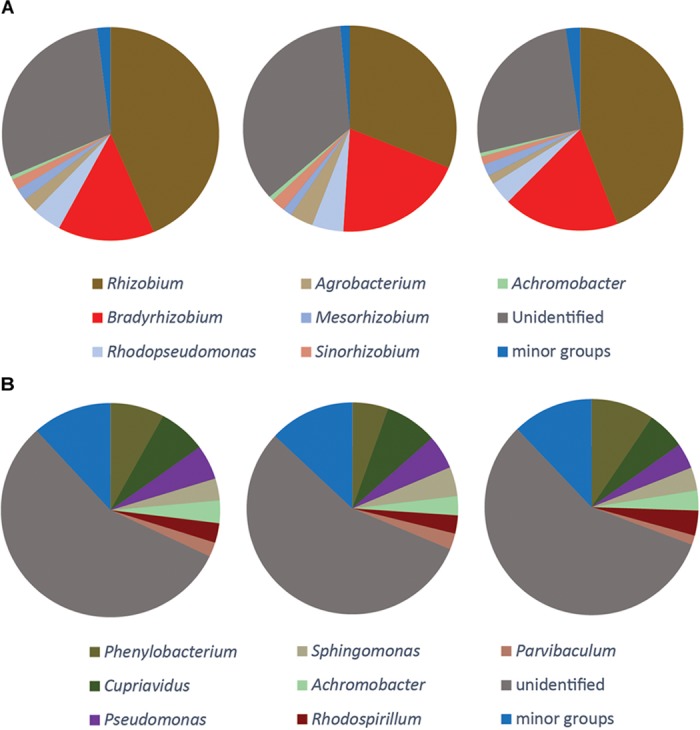
FIGURE 5.

Phylogenetic composition of the DNA of nirK gene (A), qnorB gene (B). The three pie charts show three replicate samples. No gene transcription was detected for these genes. The seven largest genera are shown and the composition of the minor groups is listed in Supplementary File S2.
