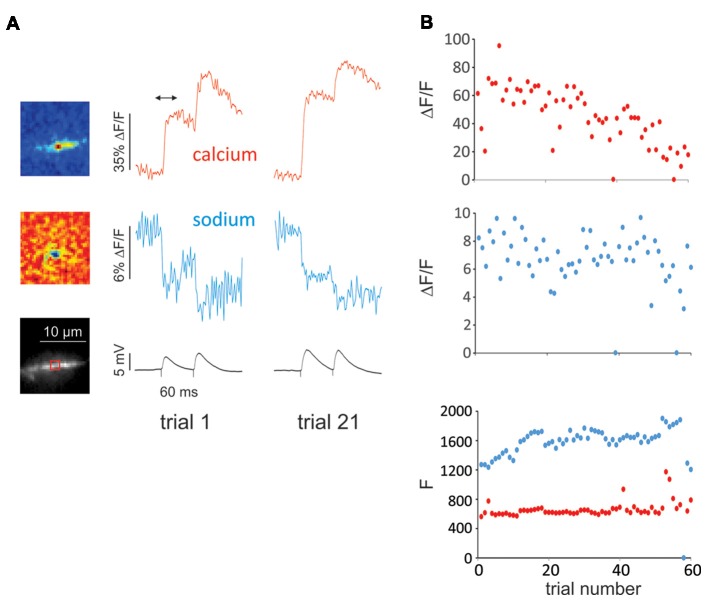
Figure 4.
Example of experiment with many trials showing little cumulative photodynamic damage reflected in single spine sodium and calcium signals. (A) Pseudocolor difference images (top) and image of dendritic region with ROI indicated (bottom). The difference images show the spatial distribution of the calcium and sodium signals from the first of two synaptic stimuli (time marked by arrow above calcium signal) of the first of 60 trials. The cells were filled with 50 μM OGB-1 and 2 mM SBFI from a patch pipette on the soma. The pseudocolor images show that both changes were localized to a small region corresponding to a dendritic spine. The traces show that the signals from trial 1 and trial 21 were about the same. (B) Plots of peak signal sizes (ΔF/F) from the first synaptic response and resting fluorescence levels (F) for all 60 trials. The F values were measured at the beginning of the traces before stimulation. The peak calcium signal (ΔF/F, red dots) decreased slightly over the many trials; the peak sodium signal (ΔF/F, blue dots) showed little deterioration. In two trials (38 and 55) there was failure in both the sodium and calcium signals (an unusually small number). The F values stayed relatively constant until the last few trials. In four trials the resting calcium F levels were high, probably because the trials were preceded by spontaneous synaptic responses. The resting sodium F value did not change significantly.

