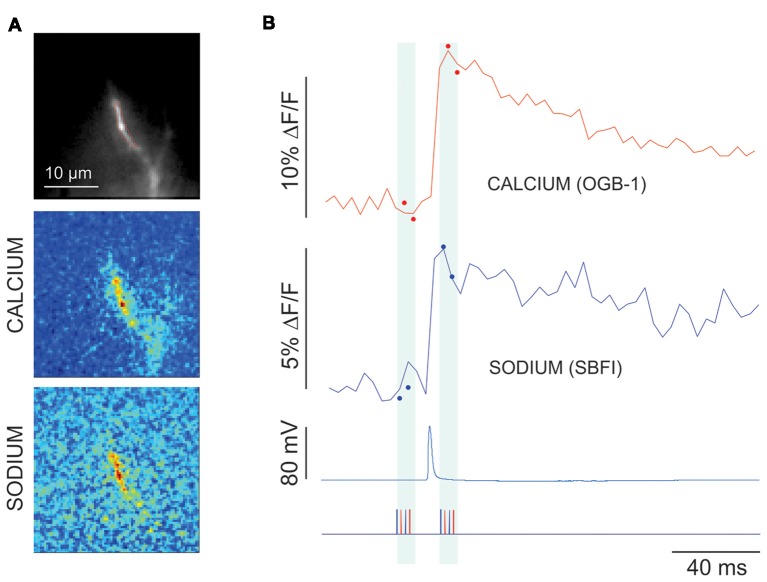
Figure 7.
Measurement of fluorescence signals using reduced illumination protocol. (A) Image using 60× lens of the axon filled with 2 mM SBFI and 50 μM OGB-1, and difference images made by only illuminating four frames (two with 377 nm laser and two with 476 nm laser) before and four frames after a single intrasomatically evoked AP. (B) Calcium (red) and sodium (blue) signals taken by limited illumination (closed circles) and full frame illumination (solid lines) from the extended ROI in the left image. Bottom trace shows timing of the light flashes of each wavelength (blue-377 nm; red-476 nm). Sodium trace and image are inverted.

