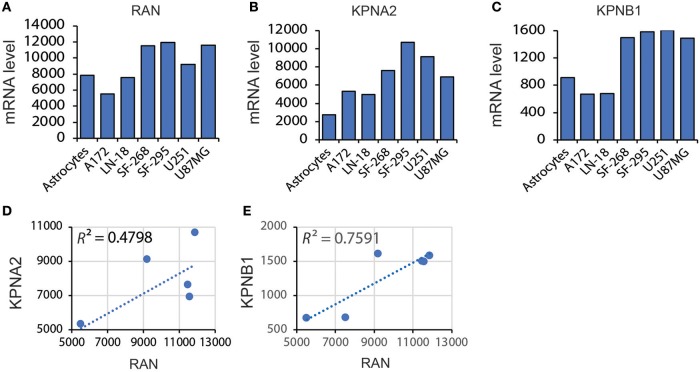
Figure 4.
Correlation between levels of RAN and KPNA2 or KPNB1 in GBM. (A) Levels of RAN mRNA in astrocytes and GBM cell lines. Data were retrieved from the BioGPS database. The intensities of probes that detect RAN mRNA are shown. (B) KPNA2 mRNA levels in astrocytes and GBM cell lines. (C) KPNB1 mRNA levels in astrocytes and GBM cell lines. (D) Correlation between mRNA levels of RAN and KPNA2 in GBM cell lines. (E) Correlation between mRNA levels of RAN and KPNB1. A linear regression model was used. R square (R2) is the coefficient of determination.

