
FIGURE 5.
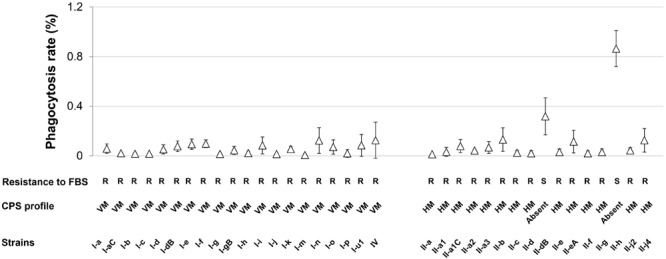
Susceptibility of A. baumannii IC I and IC II lineage strains to macrophage and serum-mediated killing. Phagocytosis by J774 macrophages is expressed as percentages and shown in a graph (Δ). Error bars represent standard deviations from three independent experiments. R and S letters below the graph denote the strains that are FBS resistant and sensitive, respectively. HM and VM indicate profile of high and variable-molecular-mass CPS, respectively. Roman numerals I and II in the strains names indicate IC I and IC II, respectively.