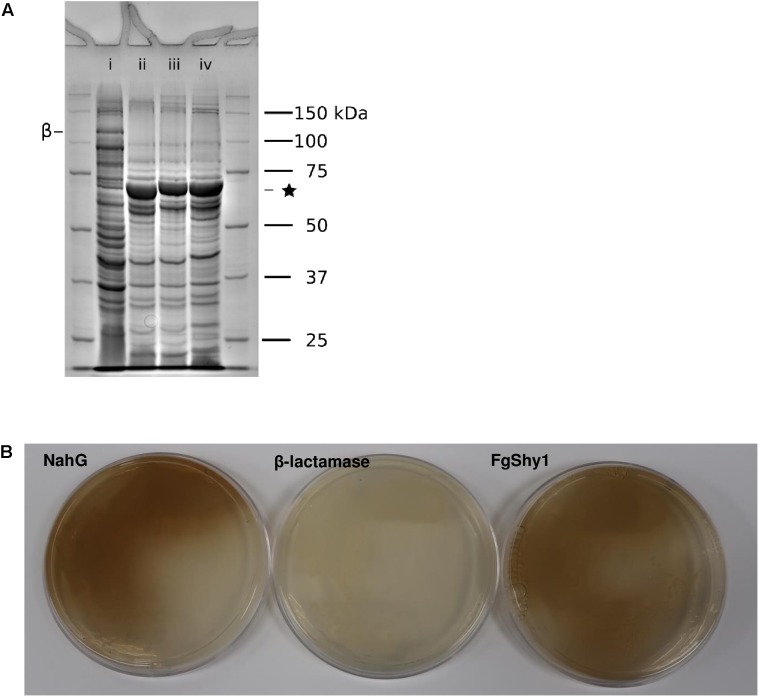
FIGURE 4.
Overexpression of FgShyC and FgShy1 protein in E. coli. (A) SDS-PAGE analysis. (i) β-Lactamase control; (ii) NahG, (iii) FgShyC; (iv) FgShy1. ∗ Marks the salicylate hydroxylase fusion proteins. β Marks the β-lactamase protein. (B) Colorimetric plate assay of FgShy1 along with a positive control NahG and a negative control β-lactamase.

