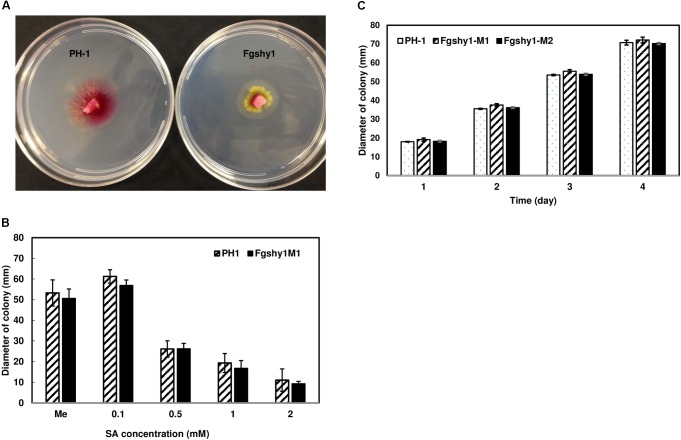
FIGURE 6.
Fgshy1 growth on agar containing SA. (A) The yellow hyphae of the Fgshy1 mutant with addition of 1 mM SA under acidic condition. (B) Growth of Fgshy1 on 1% agar plates under acidic condition with different SA concentrations. (C) Growth of Fgshy1 with 10 mM SA under neutral conditions. Wild-type PH-1 served as control. Values are averages from four biological replicates. Me, methanol. Means at each different concentrations (B) and time points (C) were analyzed independently using an ANOVA, no significant differences were detected (P > 0.05).

