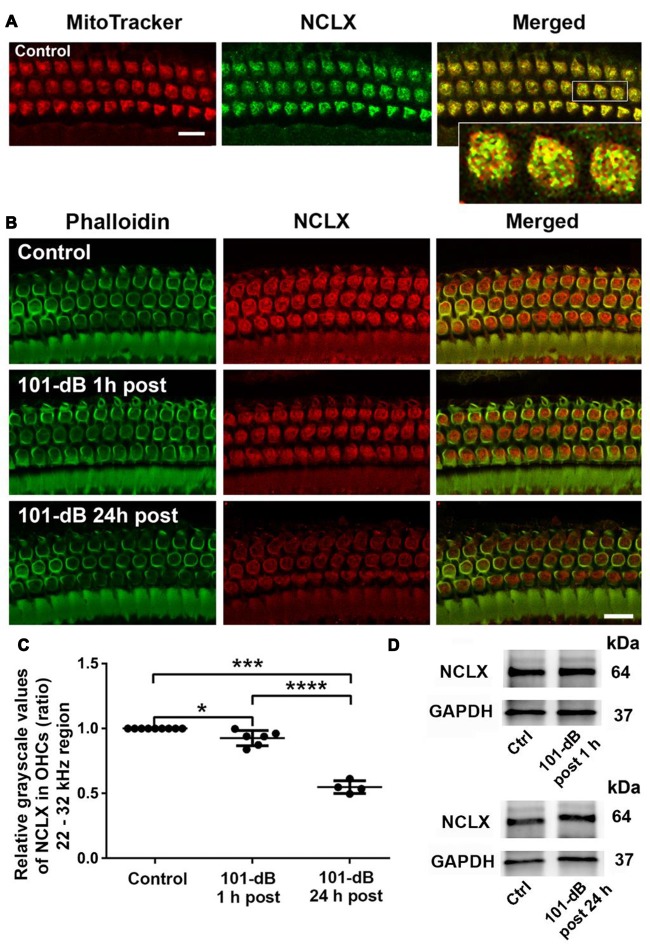
Figure 4.
Noise exposure decreased NCLX immunoreactivity in OHCs of the basal turn in a time-dependent and intensity-dependent manner. (A) Representative images of surface preparations revealed co-localization of NCLX (green) and MitoTracker (red) in OHCs (merged, yellow). An enlarged image of three OHCs better illustrates the co-localization; scale bar = 10 μm, n = 3 per group with one cochlea used per mouse. (B) Representative images for NCLX in OHCs 1 h and 24 h after completion of the exposure. Green: phalloidin-stained OHCs. Images were taken from the 22–32 kHz region of the surface preparations using a Leica SP5 confocal microscope; scale bar = 10 μm. (C) Quantitative analysis of NCLX immunolabeling in OHCs showed a significant decrease in a time-dependent manner. Data are presented as individual points and means ± SD; *p < 0.05, ***p < 0.001, ****p < 0.0001. Control: n = 9, 101-dB 1 h post: n = 6, 101-dB 24 h post: n = 4 with one cochlea used per mouse. (D) Representative immunoblots of total cochlear homogenates from CBA/J mice showed no difference in NCLX band densities between control and noise exposed mice when examined 1 h and 24 h after completion of the exposure. GAPDH served as the sample loading control; n = 6 mice per group.

