Fig. 3.
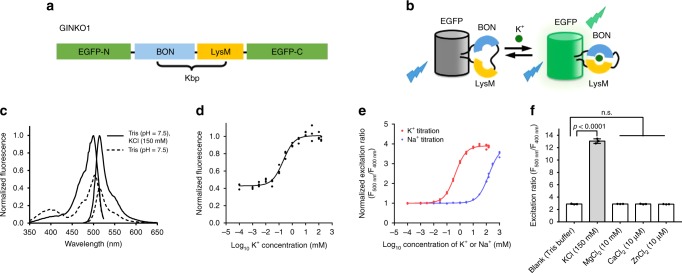
Design and in vitro characterization of GINKO1. a Design and construction of the genetically encoded K+ indicator GINKO1. b Schematic representation of the molecular sensing mechanism. c GINKO1 excitation and emission fluorescence spectrum in buffer with (solid) and without (dashed) K+. d Normalized emission intensity of purified GINKO1 protein at various concentrations of K+, data are expressed as individual data points. e Excitation ratio of purified GINKO1 protein at various concentrations of K+ (red) and Na+ (blue) solutions, data are expressed as individual data points. f Excitation fluorescence ratio of purified GINKO1 protein upon addition of various physiologically relevant ions, data are expressed as mean ± SD

