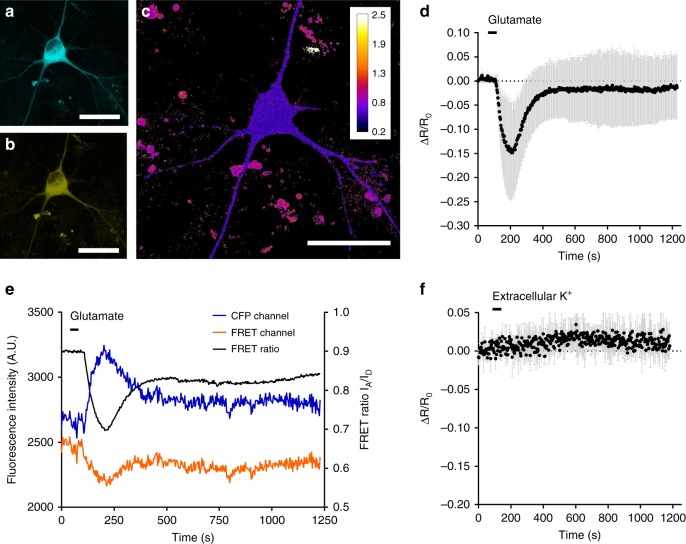
Fig. 5.
Imaging neuronal K+ dynamics using KIRIN1. a Representative donor channel image of dissociated cortical neuron expressing KIRIN1 (scale bar = 30 µm). b Representative FRET channel image (scale bar = 30 µm). c Representative FRET ratio image (scale bar = 30 µm). d FRET acceptor-to-donor fluorescence percentage ratio change time course with the treatment of glutamate (500 µM, n = 3), data are expressed as mean ± SD. e Representative traces of CFP channel intensity (blue), FRET channel intensity (orange), and FRET acceptor-to-donor fluorescence ratio (black) with the treatment of glutamate (500 µM). f FRET acceptor-to-donor fluorescence percentage ratio change time course with treatment with a high concentration (30 mM) of extracellular K+ (n = 3), data are expressed as mean ± SD

