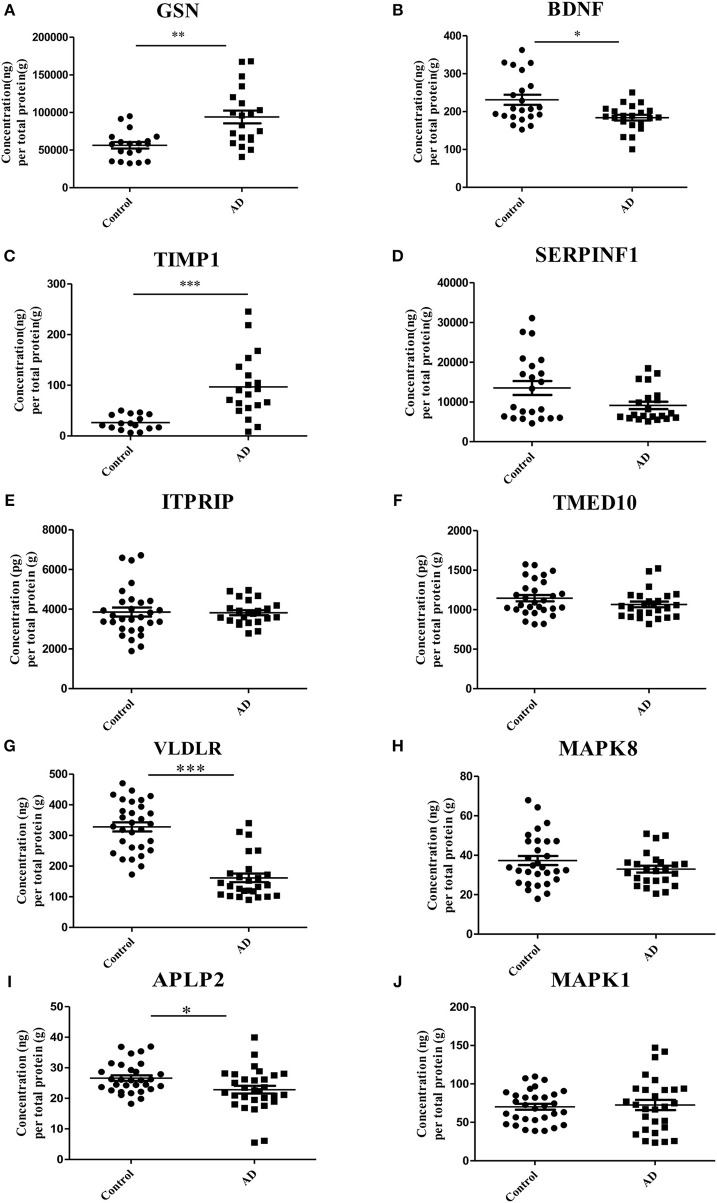
Figure 3.
Validation of the 10 selected proteins between AD samples and health controls by ELISA experiment. (A) The concentration of protein GSN in serum samples of AD and control. (B) The concentration of protein BDNF in serum samples of AD and control. (C) The concentration of protein TIMP1 in serum samples of AD and control. (D) The concentration of protein SERPINF1 in serum samples of AD and control. (E) The concentration of protein ITPRIP in serum samples of AD and control. (F) The concentration of protein TMED10 in serum samples of AD and control. (G) The concentration of protein VLDLR in serum samples of AD and control. (H) The concentration of protein MAPK8 in serum samples of AD and control. (I) The concentration of protein APLP2 in serum samples of AD and control. (J) The concentration of protein MAPK1 in serum samples of AD and control. *p < 0.05 vs. controls; **p < 0.05 vs. controls; ***p < 0.0005 vs. controls.

