Figure 4.

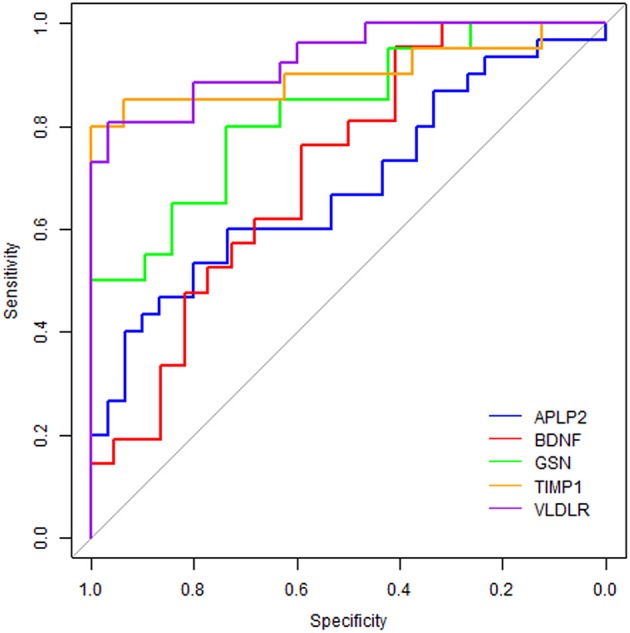
Receiver operating characteristic curve analyses on the 5 proteins. The blue line represents protein APLP2, the red line is BDNF, the green line is GSN, the orange line is TIMP1 and the purple line is VLDLR.

Receiver operating characteristic curve analyses on the 5 proteins. The blue line represents protein APLP2, the red line is BDNF, the green line is GSN, the orange line is TIMP1 and the purple line is VLDLR.