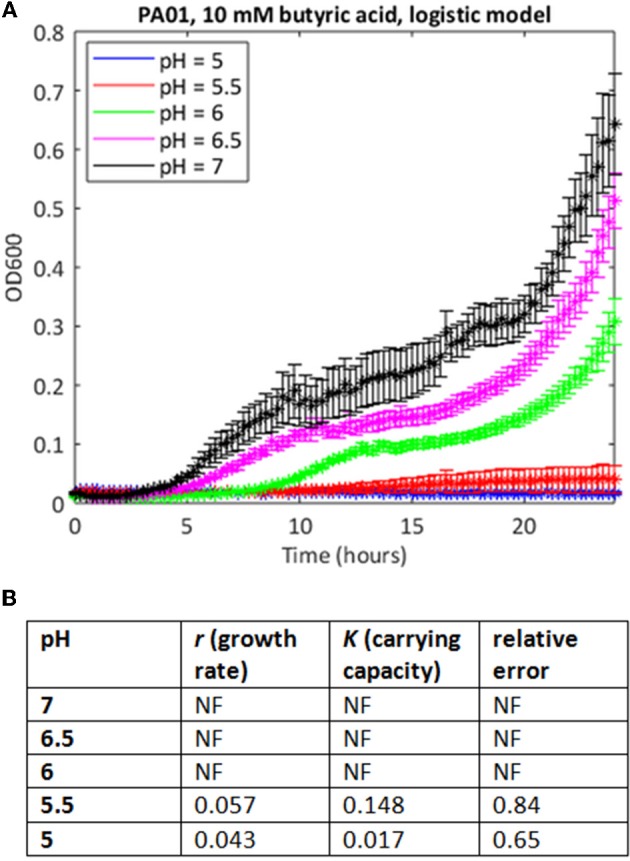
Figure 2.

Use of the simple logistic model to fit growth curve data of strain PAO1 in 10 mM butyric acid at varying pH. (A) Six replicates were used to generate mean and SEM values for growth over 24 h, and best fit curves were generated as in Figure 1. If a curve could not be generated, data points are shown but there is no continuous line. (B) Model parameters and error estimates generated by the fitting protocol: NF, no fit could be obtained.
