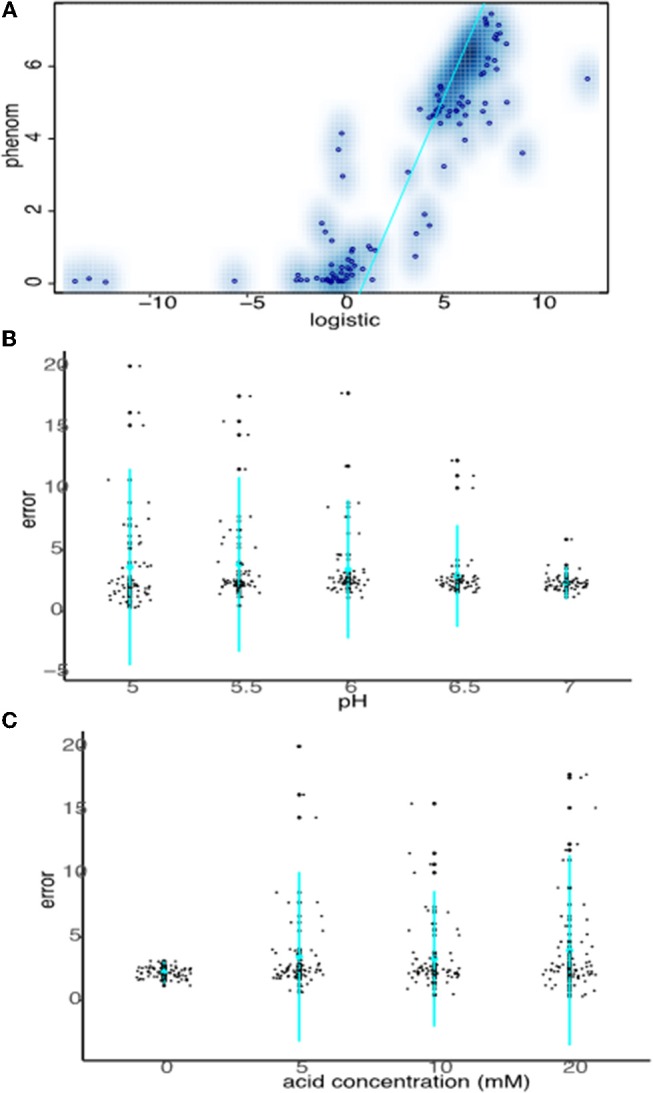
Figure 4.

Strong carrying capacity correlation between phenom and logistic models is driven by good logistic fits under non-stress conditions. (A) Scatterplot comparing carrying capacity estimates of logistic model carrying capacity estimates with those from the phenom model. Individual points represent the mean of log2 carrying capacity estimates across biological replicate samples for each pH/OA condition in each strain. Blue color density estimates surrounding point clouds represents the 2D kernel density estimate obtained via the smoothScatter() function in R. Cyan line represents the linear regression of the correlation. (B) Comparison of logistic model error fits to the data at given pH levels across acid concentrations. Individual points represent the error fit for a given pH/OA concentration combination. Cyan points represent the mean of the data for a given pH, lines represent the standard deviation. (C) As in (B), except errors at each OA concentration across pH levels are shown.
