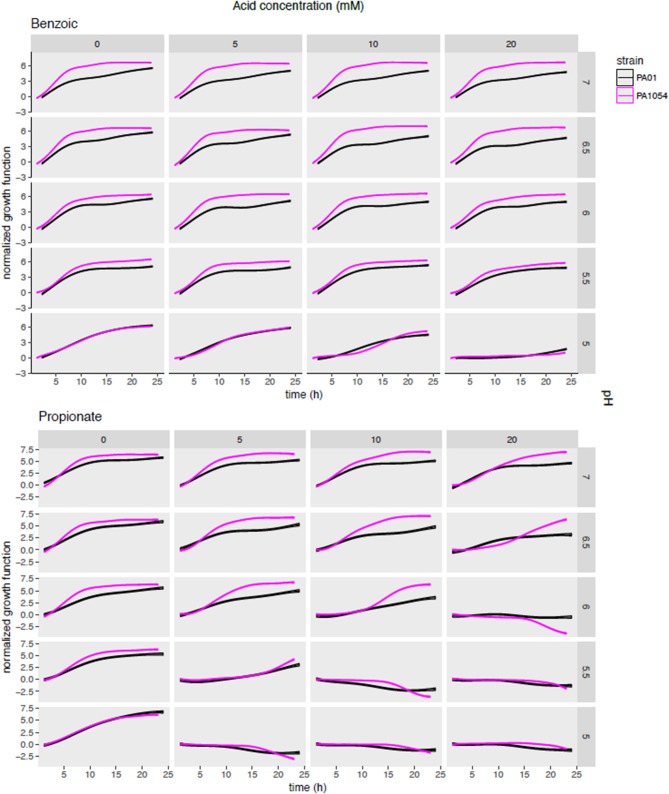
Figure 5.
Posterior predictions of growth functions across OA/pH combinations and strains. Each curve represents the growth curve mean (center line of each curve) and standard deviation (width of curve) for phenom growth fit. Each graph depicts a growth curve for each OA/pH combination. Time in hours (0–25) is given on the X-axis and log2 normalized growth function (see Methods) given on the Y-axis. Individual axis numbers are not shown for clarity of the figure, but each sub-graph shown has the same axis ranges. OA concentrations are arranged across the columns of the graph grid, and pH levels down the rows. Black lines represent growth of PAO1 strain, magenta represents PA1054. Results from only two OA types are shown for clarity, with the results from the remaining acids shown in Figure S3.

